Marketing reports often get published with tidy averages every year, and marketing teams take those figures back to their dashboards as if they’re targets worth chasing. However, they are actually not. A benchmark pulled from a dataset of thousands of advertisers, across different offer types, conversion definitions, and campaign structures, tells you almost nothing about whether your own campaigns are performing well or poorly.
PPC conversion rates measure how efficiently your paid spend turns clicks into defined actions. That definition matters more than the percentage. This article focuses specifically on how to read PPC conversion rates by industry, and how to build an internal baseline that actually means something for your business.
Reality Check: What Are the Real PPC Conversion Rates by Industry for 2026?
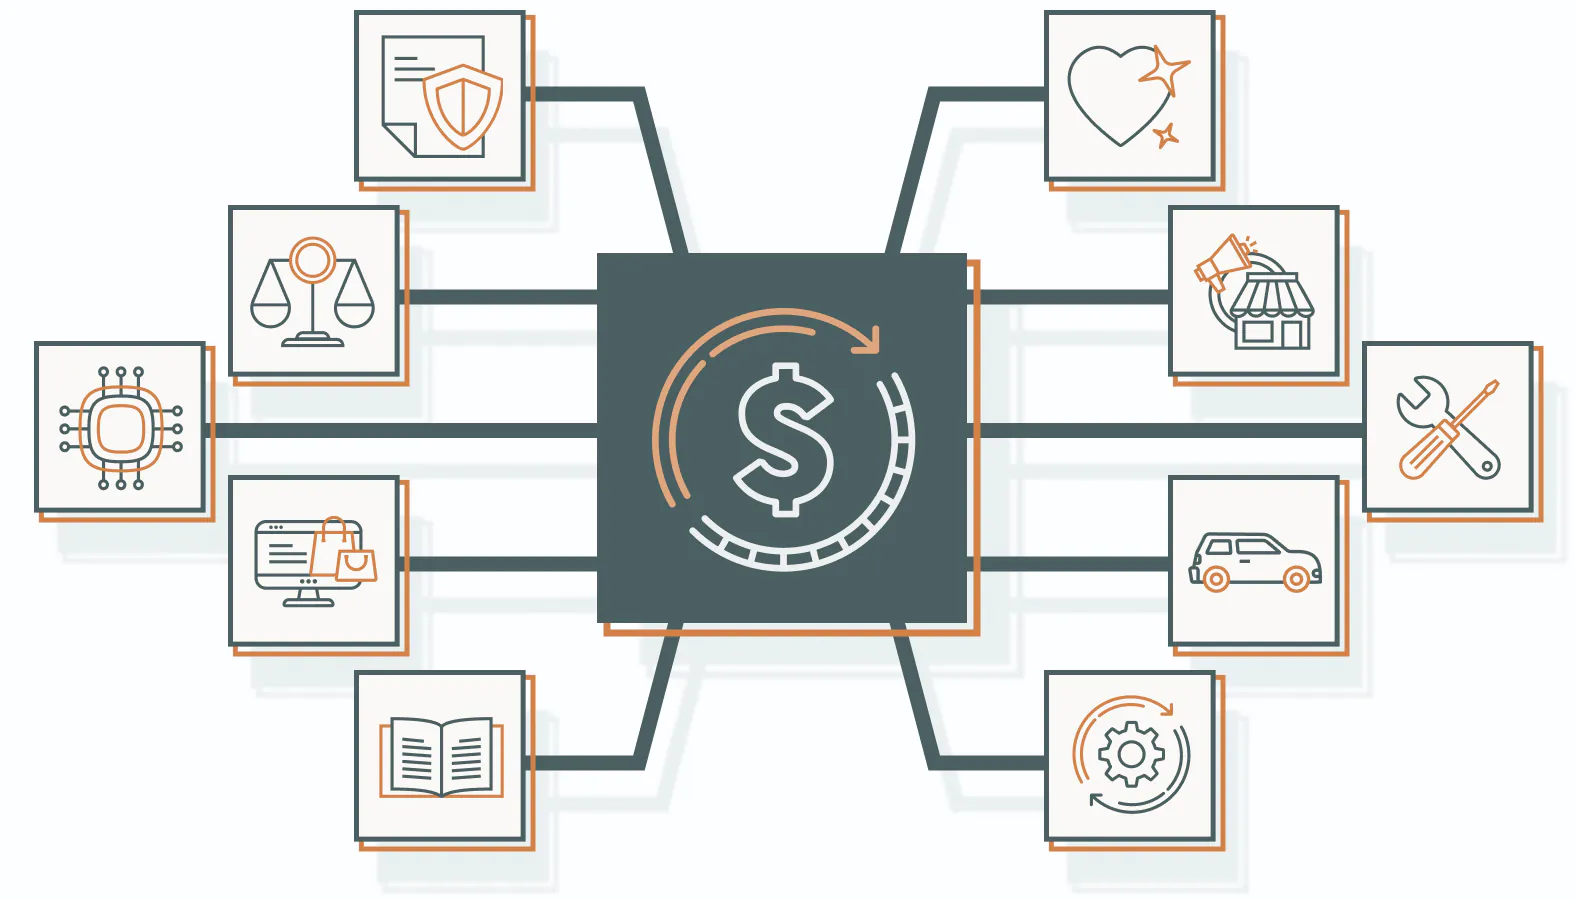
Industry benchmarks are a baseline. Below are the average PPC conversion rates by industry for 2026. Keep in mind these numbers are only helpful if you know what your conversion is.
| Industry | Average PPC Conversion Rate |
| Finance & Insurance | 2.64% |
| Legal Services | 5.55% |
| Healthcare | 12.43% |
| B2B SaaS / Technology | 4.85% |
| E-commerce (Retail) | 4.01% |
| Education | 13.14% |
| Real Estate | 3.70% |
| Home Services | 8.05% |
| Travel & Hospitality | 5.83% |
| Industrial / Manufacturing | 8.20% |
A 3.7% conversion rate sitting in a spreadsheet means nothing without knowing what action triggered it. A “conversion” for one company in the B2B SaaS row could be a completed demo request form — multi-field, requiring company name, role, team size, and a phone call commitment. For another company in the exact same row, a “conversion” is a free trial signup that takes 20 seconds and requires only an email address. Both are reported the same way in aggregate benchmarks. Both produce different conversion rates. Both get averaged together.
This is why you need to know what your conversion is and what level of friction it has before you compare your conversion rate to others in your industry.
Why the Same Category Shows Wildly Different PPC Conversion Rates by Industry
There are a few reasons why you’ll see such a wide range of PPC conversion rates by industry.
First is the search intent at the keyword level you are bidding on. There are many keywords that fall under one category that will convert at different rates. For example, if you are selling B2B SaaS software and you are bidding on “best content management system,” you will likely see a higher conversion rate than if you were bidding on “content management system”. According to Ahrefs, the person searching for best is further along in their buying journey and is more likely to convert.
Second is the price point of your product and its commitment level. If you are selling a product that costs $50k a year, you might see lower conversion rates than if you were selling a product that costs $50 a month. The buyer has to think about their purchase more and may need to consult with others before making a decision.
Finally, competition. If a competitor starts bidding on your keywords and driving up your CPCs, you may see your conversion rate decrease. This could be due to your ads being shown less or users clicking on your competitors’ ads instead.
Deconstructing the Data: What Is a Realistic PPC ROI Average for Your Sector?
The PPC ROI average question is where most conversations should start, and where most don’t. Conversion rate is a campaign metric. ROI is a business metric. Those aren’t the same, and optimizing for one without understanding the other is how paid budgets get misallocated.
Here’s a scenario that plays out more often than it should: a marketing team runs a Google Ads campaign with a 6% conversion rate. The dashboard looks great. Leadership is pleased. But the Cost Per Acquisition is $480 per lead, and the product being sold has a gross margin of 40% on an average deal size of $900. Semrush states that a higher CPC will “likely eat into your profits more,” and at those figures, the campaign is generating leads that the business cannot profitably close. The high conversion rate is obscuring that reality.
The PPC ROI average benchmark has the same problem as the conversion rate benchmark: it’s an aggregate across businesses with completely different economics. Finding your ROI baseline means you need three internal figures that no industry report can supply.
Customer lifetime value (LTV). How much money will a customer spend with you over the course of their span as your customer. If your average customer stays for 24 months and spends $200/mo on your product, your LTV would be $4,800. That’s the ceiling on what it makes sense to spend acquiring one customer before margin considerations.
Gross margin. LTV tells you revenue. Gross margin tells you what you actually keep. If you have an LTV of $4800 and a gross margin of 35%, your contribution is $1680 per customer. You want to make sure your CPA is lower than that number.
Sales cycle length. Sales cycles in B2B can take anywhere from 3-9 months+ from the time someone converts on your landing page to them actually closing revenue. You might even have a campaign that isn’t profitable after 60 days, but once you attribute closed-won revenue to that click, it could be very different after 180 days. If you’re evaluating PPC ROI average on a short time horizon, you may be cutting campaigns that would have been profitable.
These three variables (LTV, margin, and cycle length) are what a marketing director needs to calculate before benchmarking ROI against any external figure. Without them, the PPC ROI average data is context without application.
The Technical Glitch: How Conversion Tracking Setups Distort Your Baseline PPC Conversion Rates

Beware of technical glitches, so before you benchmark anything, your tracking needs to be accurate. This is where a lot of teams skip a step — they compare their PPC conversion rates against industry data without first verifying that what they’re counting as a conversion is consistent, clean, and correctly configured.
Poor data hygiene doesn’t just produce misleading reports. It produces misleading optimization decisions. If your tracking is counting bot traffic as conversions, or firing duplicate tags on the same form submission, your conversion rate is artificially inflated. If a broken Google Tag Manager trigger stops firing after a site update, your conversion rate drops overnight because measurement broke.
Attribution model shifts create the same distortion. If you have a campaign set to last click, you will be giving 100% of conversions to the last user it has before converting. According to Google Ads, switching to a data-driven attribution model distributes credit across your other campaigns based on observed conversion paths. Nothing actually changed, just your attribution model. Teams that switch attribution models mid-flight and then compare current numbers against historical benchmarks are comparing two different measurement systems, not two different performance periods.
The specific technical issues worth auditing before any benchmarking exercise:
Bot traffic. Unscrubbed bot traffic inflates both click volume and, in some cases, conversion events. IP exclusion lists and audience filters need to be maintained actively, not set up once.
Duplicate tracking scripts. A conversion event that fires twice counts as two conversions. This happens when tracking scripts are added through multiple channels, directly in the page code and also through Google Tag Manager, without deduplication logic.
Broken triggers. Site updates, theme changes, and URL restructures regularly break GTM triggers. A conversion that stopped firing three weeks ago shows up as a steady performance decline that looks like a campaign problem.
The Surface-Level Trap: Form Fills vs. Deep-Funnel Pipeline Metrics
When you happen to optimize a wrong conversion event, that might produce misleading results, even when your tracking is technically accurate. Form fills are easy to count. They show up clearly in Google Ads reports. They’re satisfying to report on. They’re also one of the weakest indicators of actual business value.
You could conclude that a campaign is effective because you’re receiving 200 leads a month. If you have 160 of those leads coming from students, job seekers, competition, or someone who took your offer wrong, and not from actual buyers or users of your products, your sales team is going to be wasting most of their time sifting through these numbers that will never convert.
The fix is connecting ad platform data to CRM pipeline metrics. When conversion events are mapped to what happens after the form is filled (did this lead become an MQL? Did it progress to a discovery call? Did it close?), the situation changes. A campaign with a 2.1% conversion rate that consistently generates MQLs with a 30% close rate is outperforming a campaign with a 5.8% conversion rate that generates leads with a 4% close rate.
It’s costly to have your Sales Development Representatives (SDRs) go through bad form fills as well. You’re creating delays in your pipeline. Your sales team will become demoralized, and you’ll have bad communication with marketing. Having more forms filled out will only make this worse. The right conversion events to optimize toward are connected to actual pipeline movement: qualified lead submissions, booked calls, completed applications — actions that have a demonstrated relationship with downstream revenue in your own CRM data.
The Blueprint: How to Optimize Your Campaigns and Safely Improve Your PPC Conversion Rates
Optimizing your campaigns and improving your PPC conversion rates starts with structure, not spend. The two most reliable paid-media levers are keyword grouping and message match — and most campaigns that underperform have problems in one or both areas.
Keyword grouping and ad group structure. Organize your keywords into tight ad groups. This will allow you to write more relevant ad copy and increase your quality score. Avoid using negative related keywords to prevent your ads from showing on irrelevant searches.
Match types and bid strategy. Broad match keywords in an unmanaged account will consistently bleed budget on irrelevant traffic. Phrase and exact match controls give you tighter alignment between search query and intent. Bid strategies need to be calibrated against the conversion event you’re actually optimizing toward — if you’ve recently updated your conversion tracking to reflect deeper-funnel events, your bid strategy needs time to relearn performance patterns before you evaluate results.
Message match between ad and landing page. When a user clicks an ad that promises “PPC management for B2B SaaS companies” and lands on a generic paid media services page, there’s a disconnect. The user expected specificity and got a broad offer. That gap is a campaign architecture problem, not a design problem. You don’t need to redesign your landing page. You just need to have one that matches what you’re advertising. Having your Ad Headline match your Landing Page Headline and Offer is one of the most significant changes you can make when running ads.
The over-optimization warning. You can get too strict with your campaigns. By narrowing down your audiences too much, using too many negative keywords, or being too specific with your match types, you will have a high-converting campaign but not enough volume. If you narrow your market down so much that your campaigns aren’t getting enough clicks per day to generate leads for your sales team, they will not meet their quota. Having a 9% conversion rate and only getting 11 clicks a day will not generate enough pipeline. At some point, conversion rate optimization has to be balanced against total pipeline volume.
Advanced Frequently Asked Questions
What is a realistic PPC ROI average for mid-market B2B tech brands?
There isn’t a magic number that will work for every business. You have to know your average customer lifetime value, margin, and sales cycle to determine what a good PPC ROI is for the type of business you’re running. Next, you can evaluate it by calculating your target CPA against your average contract value and gross margin, then measure campaigns against that internal threshold — not against an industry aggregate that bundles your business in with companies that have completely different economics.
How does device type split baseline conversion targets?
Desktop consistently outperforms mobile in B2B conversion benchmarks, and the reason is practical: professional buyers completing high-consideration purchases. Multi-field forms, demo requests, consultation bookings are almost always doing it at a desk, on a full browser, during working hours. Mobile traffic in B2B tends to skew toward early-stage research behavior. Someone checking a vendor’s pricing page on their phone during a commute is not in the same mindset as someone sitting at their desk with a procurement checklist open.
When should a marketing team stop optimizing for a higher conversion percentage?
When the cost of the next improvement exceeds the revenue it generates. Conversion rate optimization inside a paid campaign follows a diminishing returns curve. The other stopping point is volume: if optimization has narrowed your audience to the point where lead volume can no longer support the sales team’s workload, the PPC conversion rate number is misleading you. Total pipeline value matters more than conversion efficiency.
Stop Chasing Averages: Build Your True Conversion Baseline
Third-party benchmarks are useful as context. They tell you where the industry sits. What they don’t tell you is whether your specific offer, targeting, conversion definition, and customer economics put you above or below where you should be. The only data that actually drives scalable paid performance is your own historical internal data — tracked consistently, attributed correctly, and connected to real pipeline outcomes rather than surface-level form submissions.
The businesses that get real results from paid media build internal baselines, measure against those, and optimize based on what their own data shows over time. That takes more discipline than comparing dashboard figures to a benchmark report, but it’s the only approach that produces compounding returns.
Your paid media campaigns deserve more than a sanity check against an industry table. Schedule a candid conversation with one of our experts » Bring your current campaign data, your CPA targets, and your pipeline metrics, so you’ll get help diving deeper with your PPC conversion rate benchmark that reflects your actual business.