


A/B testing mistakes are often difficult to spot while an experiment is running, which can lead even experienced teams to misinterpret seemingly successful results. Data-driven marketing depends on interpreting experiment results correctly, because flawed conclusions can lead to costly decisions. A dashboard can show an apparent improvement while the underlying test data points to the wrong business decision. A team may approve a test, see a winning variant, roll it out, and move on — only to discover later that the apparent improvement was not reliable.
Leadership may make investment decisions based on flawed experiment data, with the resulting errors sometimes going unrecognized until much later. By the time it gets noticed, the budget is spent and the next quarter’s plan is already built on the same bad foundation.
This guide explains common A/B testing mistakes, why they can produce misleading results, and how a disciplined, data-led approach can improve experiment quality and decision-making.
Why A/B Testing Can Lead to Costly Decisions
Poor experimentation decisions can begin when teams treat every product or marketing decision as an A/B testing opportunity without first determining whether an experiment can answer a meaningful question. As Mind the Product notes, not every decision warrants an A/B test; indiscriminate experimentation can consume resources without producing actionable evidence. Running an experiment is not enough; the test must also be capable of answering the business question it was designed to address.
The Danger of “Averages”
An aggregate result can look like a clear win while masking meaningful differences between audience segments. A test that lifts overall conversion by 8% might be doing that through one segment while hurting another, and the average never tells you that split. Leaders who rely only on aggregate metrics risk overlooking important differences between audience segments.
Treat summary metrics as the beginning of your analysis, not the final conclusion. Examine relevant audience segments before deciding whether the overall result is robust enough to support a rollout.
Moving Beyond Vanity Metrics
A lift in click-through rate can coexist with lower pipeline or closed-won revenue when the additional clicks come from lower-intent visitors. A headline that generates more clicks does not necessarily attract visitors with stronger buying intent. If the variant that “won” on CTR is attracting lower-intent visitors who never convert, the test succeeded on the metric you tracked, but failed on driving revenue.
This gap is the reason why the metric you pick matters as much as the test itself. Choose the wrong success metric, and even a statistically sound test can lead to the wrong business decision.
6 Common A/B Testing Mistakes Skewing Your Data
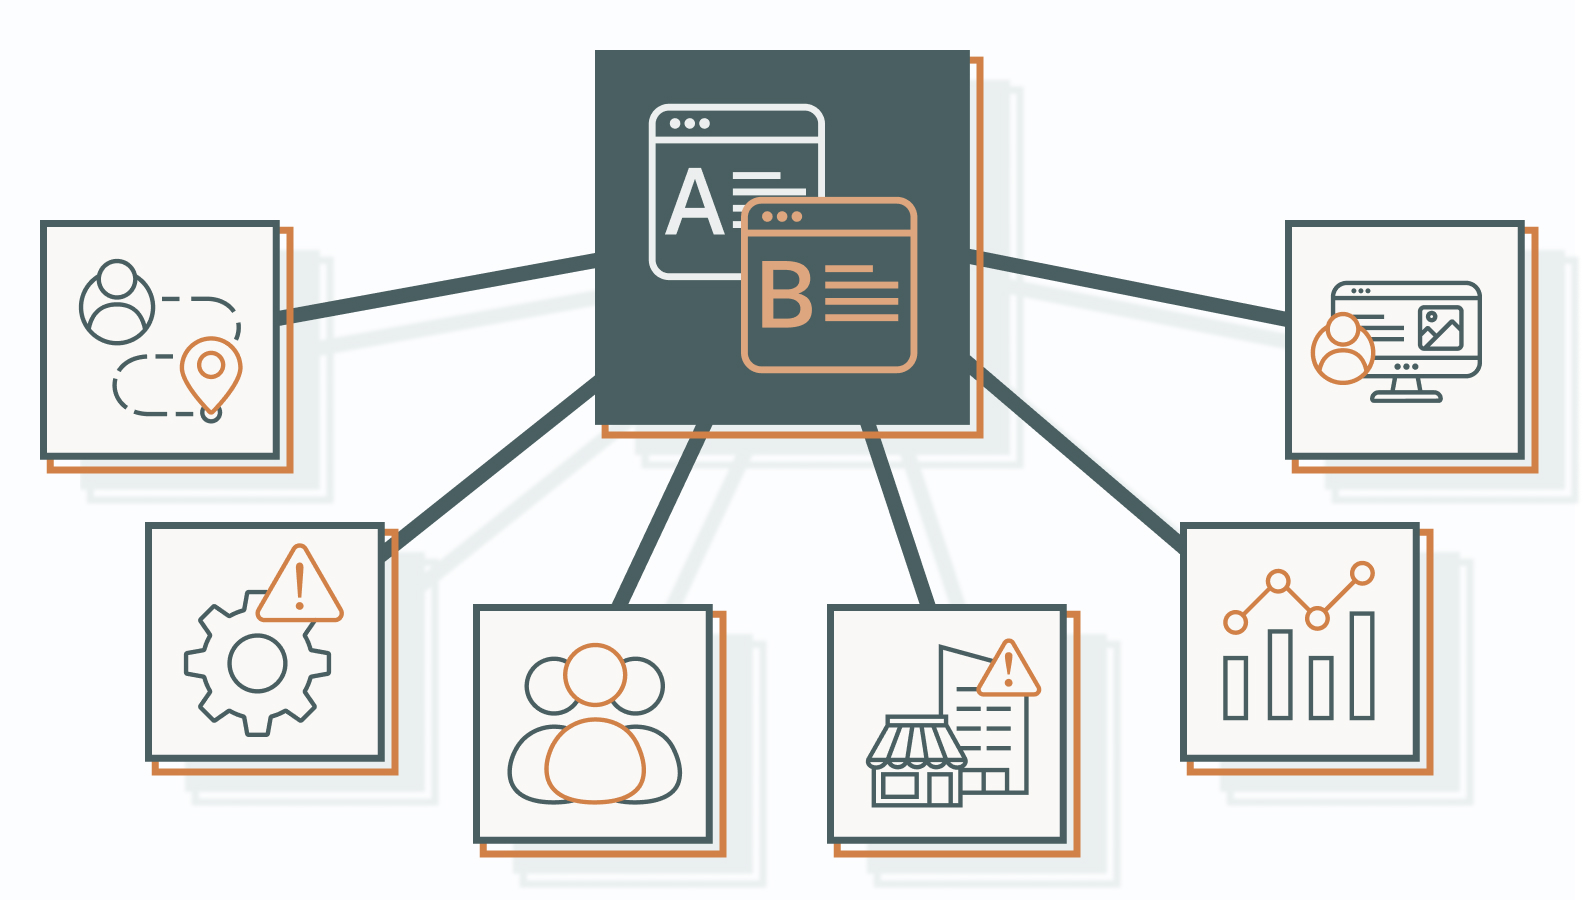
These six common mistakes to avoid in A/B testing can produce misleading results, from weak hypotheses and premature stopping to inadequate sample sizes and poor interpretation.
1) Testing Without a Falsifiable Hypothesis
Every experiment should begin with a falsifiable hypothesis that defines the expected effect, target metric, and direction of change so the result can be evaluated objectively. “Improve engagement” isn’t testable. “Changing the CTA from ‘Book a Demo’ to ‘Schedule a Consultation’ will increase the demo-request conversion rate by 10% relative to the control” is testable because it defines the treatment, metric, direction, and expected effect. Write every hypothesis this way before it launches, not a vague goal you explain away after the results come in.
Teams that skip pre-test hypothesis definition may unconsciously shape their interpretation around patterns discovered after the test ends. This approach turns experimentation into hindsight justification rather than evidence-based decision-making.
2) “Peeking” and Premature Optimization
Ending a test before it reaches the predetermined sample size or stopping criteria significantly increases the likelihood of false-positive results. Optimizely’s research found that continuous monitoring of fixed-horizon A/B tests could increase error rates substantially; in its simulations, checking results every 1,000 visitors increased the chance of a false declaration to about 20%, compared with a 5% target. Optimizely’s Stats Engine uses sequential testing to support valid decision-making while results are monitored continuously. Early results fluctuate constantly. A variant that looks like a clear winner on day three can flatten out completely by day fourteen. Define the stopping rule before launch, whether you are using a fixed-horizon design or a validated sequential-testing method, and avoid changing the methodology because of early results.
There will be an urge to check early, especially when a stakeholder wants daily updates. Set the expectation up front that results won’t be shared until the set checkpoint. That discipline can reduce the risk of premature decisions based on unstable early results.
3) The Sample Size Trap & Low-Traffic Realities
A test with insufficient sample size may lack the statistical power needed to distinguish a real effect from random variation, even when the observed difference looks large. Low-traffic websites face this challenge frequently because reaching a statistically valid sample can take months instead of weeks. Underpowered experiments produce unreliable conclusions because random variation can easily outweigh genuine performance differences. Estimate the required sample size before launch using your baseline conversion rate, minimum detectable effect, significance level, and desired statistical power. If your traffic can’t support that in a reasonable window, test higher-impact pages first or extend the window rather than calling an underpowered test early.
A 30% observed lift from only 40 visitors may carry substantial uncertainty, so it should not be treated as evidence of a durable effect without sufficient statistical power. It’s noise that looks like a result. Rolling out a change based on it is a guess, not a decision.
4) Blindness to External Confounding Variables
External factors can confound test results when they affect traffic, user behavior, or conversion independently of the tested change. Common external confounding variables include:
- Seasonal or day-of-week changes in buyer behavior
- Concurrent campaigns that alter traffic volume or audience mix
- Technical incidents that affect one variant differently
- PR coverage, industry events, or competitor activity that changes traffic composition
Write down what else happened during your test window every time, and if a result lines up with one of these events, question it before you act on it.
A test that coincides with a major industry conference or competitor campaign may reflect changes in traffic composition or user behavior that are unrelated to the tested variant. Skipping this check credits a headline change for a lift that came from something outside the test.
5) Diluting Data by Neglecting Audience Segmentation
Aggregating results across different audience segments can conceal meaningful performance differences. A variant might do well for mobile visitors but poorly for desktop, or convert well for returning visitors and badly for the new ones. That blended average hides both signals.
Use aggregate results as the primary view, then examine pre-specified or strategically relevant segments such as:
- Device type
- Traffic source
- New versus returning visitor status
- Geographic region, when relevant to your business
A test can win overall while producing a weaker result in an important segment, but segment-level findings should be interpreted cautiously when they were not part of the original hypothesis. Enterprise visitors and small-business visitors often behave very differently on the same page, and a blended result can hide the split that matters most to your revenue.
6) Multivariate Overwhelm
Multivariate testing becomes harder to design and interpret as the number of variables and combinations increases, particularly when traffic is insufficient to estimate main effects and interactions reliably. Improvado’s guide on multivariate testing states that a test with 12 combinations, such as two headlines, three images, and two CTAs, requires substantially more traffic because users are distributed across 12 combinations rather than two. The exact sample requirement depends on the baseline rate, minimum detectable effect, desired power, and statistical design. Use simple A/B tests when you need to isolate a specific change; consider multivariate testing when you have sufficient traffic and a clear hypothesis about how multiple elements may interact.
A test that changes the headline, image, and button copy all at once might produce a winner, but you won’t know which change caused it. That uncertainty carries into every future decision built on the assumption that you understood what worked.
Building a Culture of Trustworthy, ROI-Led Experimentation
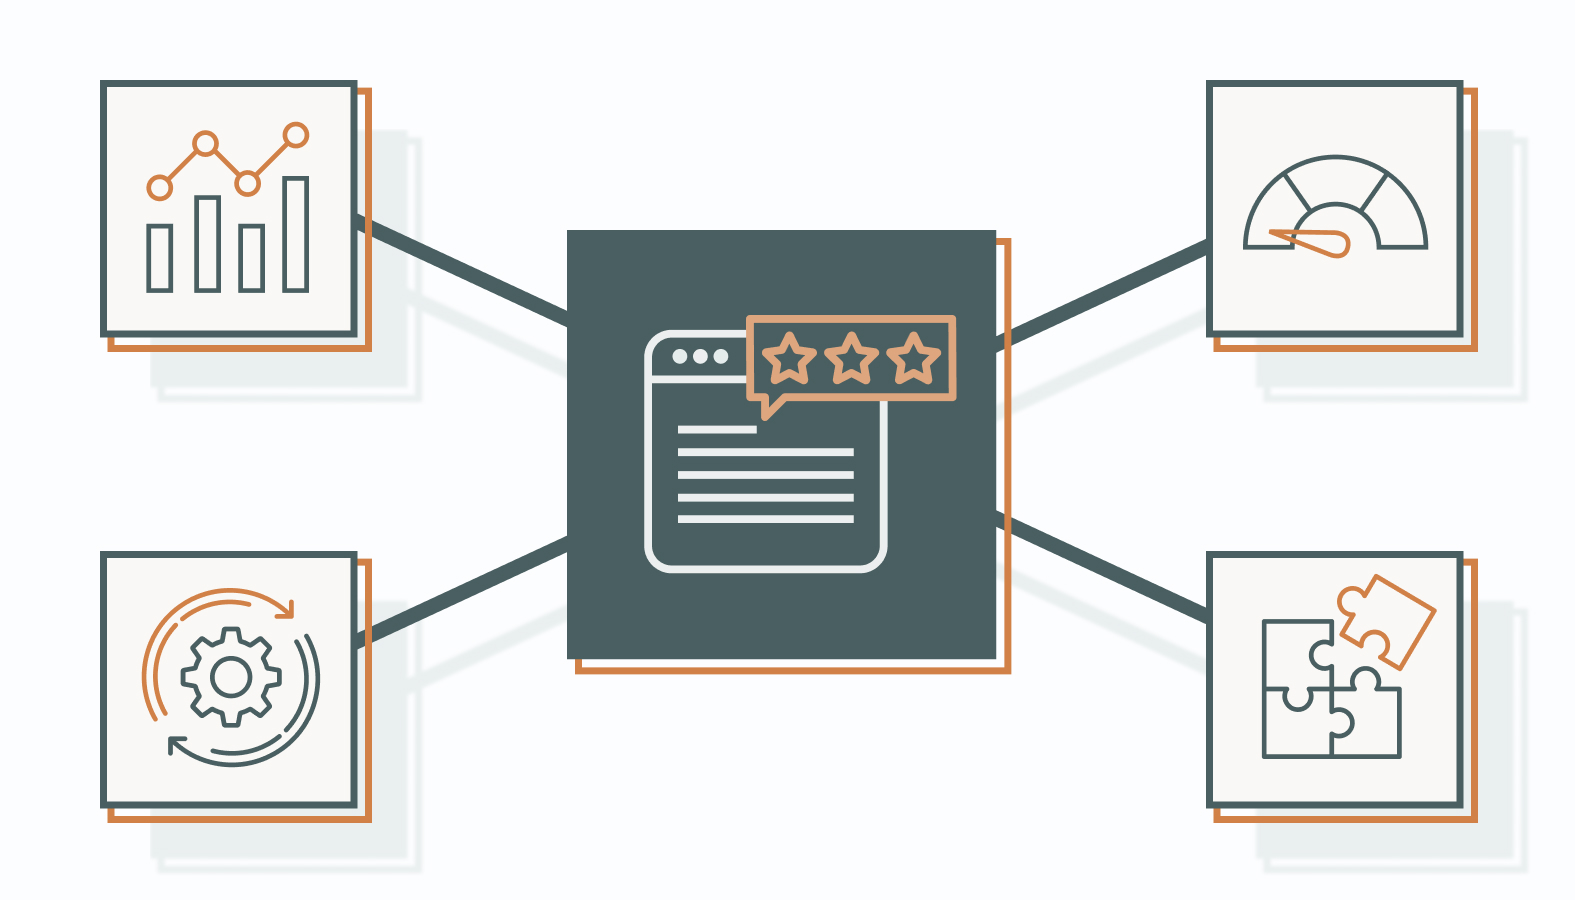
Trustworthy experimentation comes from changing what you measure, how you treat failure, and how testing connects to your revenue operation.
Shifting KPIs from Vanity Metrics to Bottom-Line Pipeline Impact
Every experiment should define a primary success metric that reflects its intended user or business outcome and, where possible, establish how that metric relates to downstream pipeline, revenue, retention, or customer lifetime value. Secondary metrics can provide useful context, but they shouldn’t determine whether a test succeeds. If a test report focuses on click-through rate or bounce rate without explaining how those metrics relate to downstream outcomes, decision-makers may struggle to assess the experiment’s business impact. Build the connection between test metric and revenue metric into the test design from the start, not as an afterthought once leadership asks why the win didn’t translate.
Using Negative and Inconclusive Tests as High-Value Data
Negative results can provide evidence against an approach, while inconclusive results can identify ideas that require more data or a better test design before a decision is made. Treat a well-powered negative result as useful evidence, while distinguishing it from an inconclusive result caused by insufficient data.
Teams that only report wins repeat the same mistakes across different campaigns, since nobody tracks what’s already been ruled out. A documented “no” saves someone from testing the same idea again in six months.
Integrating Testing Infrastructure Directly into Your RevOps Loop
Experimentation data creates the most value when it’s connected to your Sales Enablement & RevOps infrastructure. Gartner found that sales organizations that align cross-functional KPIs are nearly three times more likely to exceed new-customer acquisition targets. In practice, that’s the same principle at work when testing data reaches the systems sales relies on. Integrate experimentation data with your CRM, analytics platform, and RevOps workflows so insights influence both marketing and sales decisions.
A test result stuck in a marketing dashboard, disconnected from the CRM sales actually uses, stays a marketing story instead of a business outcome. Connecting those systems helps teams determine whether an experiment produced measurable downstream business impact.
Standardizing a Repeatable Framework for Compounded Learning
Long-term experimentation maturity depends on documenting hypotheses, test methods, results, limitations, and follow-up actions so each experiment builds on previous evidence. This ensures every experiment builds on previous insights instead of starting from scratch. That’s where real testing maturity comes from.
Without that structure, experiment knowledge can disappear when team members leave. A documented framework preserves the reasoning, evidence, and lessons behind past decisions.
Frequently Asked Questions About A/B Testing Flaws
1) How long should we run a B2B A/B test to ensure data integrity?
A B2B A/B tests should run long enough to capture representative user behavior and reach its pre-specified stopping criteria. For many websites, covering at least one full weekly cycle can help account for day-of-week effects. Running a test for only a few days can capture temporary changes in traffic or user behavior, particularly when results vary by weekday, campaign schedule, or other recurring patterns.
2) What should we do if our B2B website traffic is too low for standard sample sizes?
If traffic is limited, prioritize experiments with meaningful potential impact, extend the test when practical, or use an appropriate sequential-testing method when continuous monitoring is needed. Do not assume that a different statistical method eliminates the need for sufficient data. Don’t force a traditional split test that will never reach significance in a reasonable time.
3) How can we tell if an external variable skewed our test results?
Check your test window against your marketing calendar, seasonal patterns, and any technical incidents logged during that period. If a result coincides with an external event, interpret it cautiously and consider rerunning the experiment after the external factor has passed or analyzing whether the effect persists across relevant cohorts.
4) Why does a winning front-end A/B test sometimes fail to increase closed revenue?
Because engagement metrics such as clicks can increase without improving lead quality, pipeline progression, or closed-won revenue. A variant can generate more clicks while attracting lower-quality traffic that never contributes to revenue. That gap can indicate that the experiment is optimizing an upstream metric without sufficiently accounting for downstream business outcomes.
5) Is multivariate testing better than standard A/B testing for growth?
Not by default. Multivariate testing is most useful when there is sufficient traffic and a specific hypothesis about how multiple variables may interact. For many B2B sites, simple A/B tests are more practical because they require fewer traffic combinations and are easier to interpret; multivariate testing becomes more useful when sufficient traffic and a clear interaction hypothesis justify the added complexity.
Beyond the Metrics: Building a Culture of Evidence-Based Experimentation
Data-first marketing means distinguishing metrics that indicate engagement from those that demonstrate meaningful progress toward business outcomes. A convincing result is not necessarily a reliable one; teams should evaluate the test design, measurement framework, and limitations before acting on the finding. That gap between a confident result and a reliable conclusion can lead to repeated investment in decisions that have not been adequately validated.
If your team’s A/B test wins are not translating into pipeline or revenue outcomes, review the test design, success metrics, and downstream attribution before scaling additional changes. Schedule a candid conversation with one of our experts » to review your recent experiments, measurement framework, and marketing infrastructure. Bring your recent test reports, and our team can help identify potential issues with test design, measurement, interpretation, and downstream attribution.