Marketing performance shows how effectively your marketing activity contributes to business goals. Measuring it well connects what your marketing team does every day to the revenue outcomes your leadership cares about. Collecting data is only the starting point. Its value comes from the decisions it supports.
This article breaks down the difference between a baseline, a benchmark, a target, and a KPI, then walks you through how to set each one correctly, compare performance, and align your marketing efforts with business goals
Decoding the Vocabulary of Marketing Performance
Before you can measure anything meaningfully, you need to use the right vocabulary. When these four terms get conflated in executive conversations, teams can end up chasing the wrong thing.
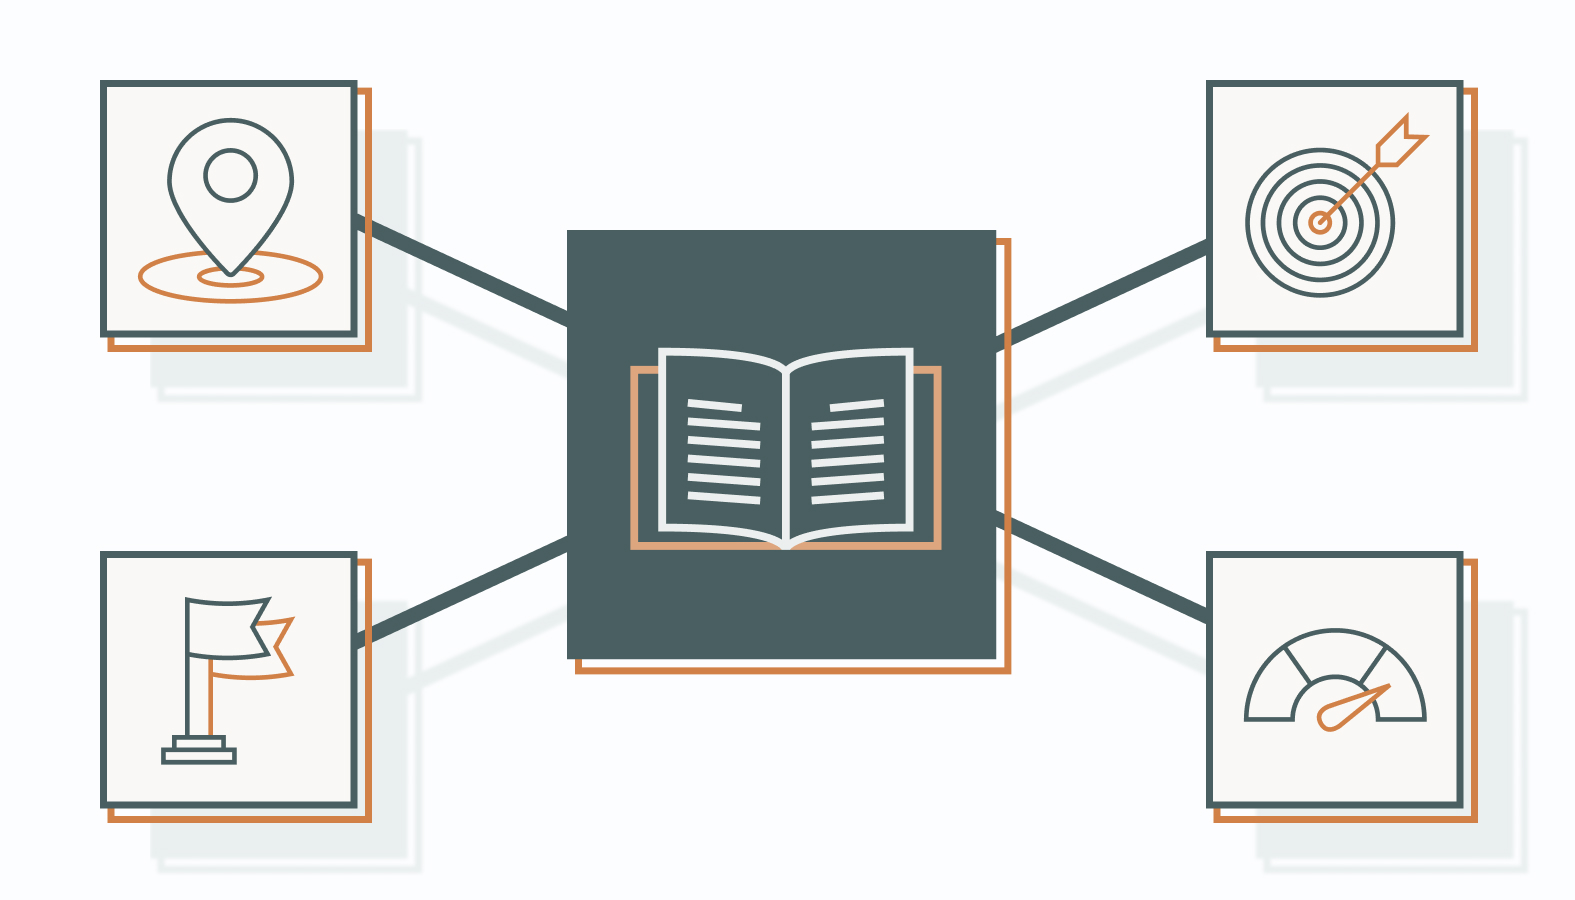
1) A baseline is your historical starting point: what your performance looked like over a defined past period.
2) A benchmark is a reference point used to evaluate performance. It can come from a comparable internal team or period, or from relevant external industry data.
3) A target is the result you aim to achieve within a defined period, based on business priorities, historical performance, available resources, and relevant benchmarks.
4) A KPI is the specific metric you track to confirm whether you’re moving toward that target or drifting away from it.
Getting these definitions wrong has consequences. Teams that skip the baseline and jump straight to industry benchmarks end up chasing averages that have nothing to do with their actual cost structure or sales cycle. Targets need a defensible basis: historical performance, business economics, execution capacity, and relevant benchmarks where available.
Why Strategic Grounding Beats Chasing Averages in Marketing Performance
Broad industry averages can combine companies with very different margins, sales cycles, budget scales, and brand histories. A SaaS company with a 14-day free trial operates very differently from a B2B services firm with a six-month sales cycle, but both might fall under the same “technology” benchmark.
A higher customer acquisition cost (CAC) is not automatically a problem. Evaluate it alongside margin-adjusted customer lifetime value (CLV), retention, and CAC payback time – the time needed to recover acquisition costs. A favorable CLV:CAC ratio alone does not establish whether acquisition spending is sustainable.
Treating a broad average as your target can push your team toward results that do not fit your economics. Targets grounded in your historical performance help you judge what is achievable within your budget and operating constraints.
Step 1: Establishing Your Internal Baseline (The Truth Is in Your History)
Your internal baseline shows what your marketing actually produced, not what you projected or hoped for. Take time to validate the baseline before using it to set future targets.
Choose a baseline period long enough to capture normal variation and allow leads to convert. Compare equivalent seasonal periods where relevant, and document changes in pricing, channel mix, or tracking that could affect the comparison. Calculate rates from the underlying totals rather than averaging monthly percentages when volumes differ.
Auditing Historical Data Streams to Measure Marketing Performance
Building a reliable baseline starts with one view of your data: CRM pipeline records, web analytics, paid media, and email data, cross-referenced against actual closed-won revenue. If those systems don’t talk to each other cleanly, the baseline you build will inherit those gaps.
Check whether marketing-generated leads can be traced through the CRM to opportunities and closed-won deals. Investigate unexplained gaps after accounting for differences in event definitions, reporting periods, and attribution windows.
Prioritizing Unit Economics in Your Baseline
Once data is consolidated, narrow your focus to the metrics that connect directly to revenue. Impressions, clicks, and social engagement can help assess awareness and engagement, but they do not establish revenue performance on their own.
The metrics that belong at the center of a baseline:
- Customer Acquisition Cost (CAC): Total sales and marketing costs associated with acquiring new customers, divided by the number of customers acquired. Document the reporting period and how you account for acquisition lag.
- Customer Lifetime Value (CLV): The estimated value a customer generates over the relationship. For profitability comparisons with CAC, use a margin-adjusted calculation and document the assumptions.
- Return on Marketing Investment (ROMI): Incremental contribution before marketing costs, minus marketing spend, divided by marketing spend. Multiply by 100 to express the result as a percentage.
Track these metrics using documented definitions, consistent cost allocations, and appropriate reporting periods or customer cohorts. Together, they help connect acquisition spending with customer value and profitability.
A campaign that drove 10,000 clicks but produced no recorded pipeline still belongs in your baseline.
Step 2: Understanding What Is Benchmarking in Marketing
Benchmarking in marketing means comparing performance against a relevant reference point, such as an internal standard or reliable data from comparable companies. The goal is not to copy competitors. It is to identify where a meaningful gap exists between your current output and what is achievable.
Understanding What Is Benchmarking in Marketing vs. Historical Baselining
A baseline establishes your starting point. A benchmark provides a reference for comparison. External benchmarks add market context; internal benchmarks help compare teams, segments, or periods. These comparisons answer different questions; use external data only when it is sufficiently comparable. For example, a 15% year-over-year reduction in CAC shows internal improvement. If comparable peers report larger reductions, investigate the gap. But first, check their starting costs, customer mix, and calculation methods.
When your business operates in a niche segment with few comparables, or benchmark data comes from companies with different scale or cost structures, lean harder on your internal trend data. A benchmark built on irrelevant comparables is worse than no benchmark at all.
Using Competitor Data Without Assuming the Same Results
External benchmarking carries a specific risk: teams sometimes assume a competitor’s results are transferable. If a competitor spends twice your LinkedIn budget and generates a strong pipeline, doubling your spend will not necessarily produce the same result. Their audience, offer, and sales process are different from yours.
Use competitor intelligence to identify gaps in messaging and offer structure, not to mirror spend allocation. Look at where a competitor ranks for terms you do not, then evaluate whether that gap is a revenue opportunity or simply reflects a different strategic priority. Use benchmark data to investigate performance gaps, then set targets that reflect your margins, resources, and operating constraints.
Step 3: Setting Targets That Scale Without Breaking
A target built on wishful thinking collapses the moment it meets pipeline data. A target built on your internal baseline, pressure-tested against credible benchmarks, and adjusted for realistic execution capacity is one your team can execute against.
Setting SMART Targets from Performance Data
Layer your historical baseline with seasonal performance patterns from the past two to three years and a realistic assessment of your current pipeline capacity. For example, if your historical data shows a 30% drop in inbound activity during the last two weeks of December, account for that pattern when setting Q4 targets.
Pipeline capacity matters equally. For illustration, if 12% of marketing-qualified leads (MQLs) become customers, you need 250 MQLs to generate 30 customers, assuming the rate holds and enough time passes for those leads to convert. If sales can support only 20 new customers per month, the target also requires a capacity increase.
Smart Insights defines SMART objectives (Specific, Measurable, Actionable, Relevant, and Time-bound) as a structured approach to ensuring marketing targets are grounded in real data rather than built on assumptions.
Fixing Funnel Leaks Before Increasing Spend
Increasing spend before resolving funnel problems can amplify inefficiencies. Before increasing top-of-funnel spend, audit the full conversion path: landing page load speed, mobile responsiveness, form friction, pixel accuracy, and CRM handoff timing.
A misconfigured tracking pixel can undercount, duplicate, or misattribute conversions. Those errors can distort channel comparisons and lead to poor budget decisions. Fix the funnel before scaling the volume.
Step 4: How to Align Business Goals with Agency Marketing Strategies
Aligning your agency’s work with business goals requires shared targets, consistent metric definitions, access to relevant reporting, and clear ownership of the actions needed to improve results.
Aligning Agency Strategies with Your Sales Pipeline
Misalignment can emerge when marketing reports MQL volume while sales reports closed deals, without a shared view of how leads progress between those stages. Agree on handoff criteria and reporting definitions so both teams can identify where leads stall and who owns the next step.
Fix this by establishing a shared data environment. Give your agency partner access to the CRM reporting needed to evaluate lead quality, pipeline progression, and closed-won outcomes. Without visibility into what happens to the leads it generates downstream, an agency optimizes for the metrics it can see, such as traffic, clicks, and MQL volume, none of which map directly to revenue.
Set clear definitions in writing before the engagement starts: what qualifies as a lead, how the handoff works, and which conversion metrics the agency is expected to move. Without these definitions, every performance review becomes a negotiation about what the data means rather than a conversation about what to do next.
Defining Review Cadences and Action Thresholds
An action threshold is a predefined result that triggers investigation or a specific response. Unlike a target, which states what you want to achieve, a threshold tells the team when to intervene.
Set thresholds using historical variability, reporting volume, and conversion lag. Assign an owner to each one and define what they should check before changing spend or strategy. Review milestones should reflect the sales cycle and distinguish the outcomes your agency controls from those that depend on your internal team.
| Element | Illustrative example |
| KPI | Customer acquisition cost |
| Baseline | $1,200 across the previous two completed quarters |
| Benchmark | $1,050 in a comparable internal period using the same cost definition |
| Target | Reduce CAC to $1,100 next quarter while maintaining new-customer volume |
| Action threshold | Investigate if CAC exceeds $1,250 for two completed monthly reporting periods |
| Response | Review acquisition costs, conversion rates, customer mix, and reporting lag before changing spend |
These figures are hypothetical. Choose thresholds that reflect your business’s normal variation, sales cycle, and tolerance for risk.
Overcoming Structural Bottlenecks in Performance Tracking

Even with the right framework, inconsistent data and biased interpretation can undermine performance comparisons.
Review bias can arise when the team executing campaigns also evaluates its own performance without agreed criteria or independent challenge. Teams may give more weight to evidence that supports their campaign decisions than to evidence that challenges them. An independent review can help challenge assumptions, especially when it uses clear criteria and reliable data.
Poor CRM hygiene shows up across attribution data, pipeline velocity, and conversion rate reporting. Duplicate records inflate contact counts. Failed automation syncs create gaps in lead scoring. Misconfigured conversion events can distort channel comparisons and lead to poor budget decisions.
Attribution differences can make performance comparisons misleading. First- and last-click models emphasize different parts of the customer journey, while multi-touch models distribute credit across recorded interactions. Use a consistent model and attribution window when comparing results, and document tracking gaps that could affect the numbers.
FAQs About Marketing Performance & Benchmarking
1) What is the difference between marketing performance and performance marketing?
Marketing performance describes how effectively marketing contributes to business goals. Performance marketing focuses on measurable actions, such as leads or sales, and often uses payment models tied to clicks or conversions. A company can run performance marketing campaigns and still struggle to measure their wider business impact.
2) What is benchmarking in marketing and why is it important for growth?
Benchmarking in marketing means comparing performance against a relevant internal or external reference point. It helps you identify gaps and test whether a target is reasonable. Where reliable benchmarks are unavailable, use historical performance, business economics, and execution capacity to guide target setting.
3) How do you align business goals with agency marketing strategies effectively?
Agree on business goals, metric definitions, and reporting access at the start of the engagement. Define which results the agency owns, which depend on your sales team, and what action follows a missed target. Shared visibility into lead quality, pipeline progression, and closed-won outcomes helps both teams make better decisions.
4) How often should a business review its marketing performance benchmarks?
Review operational KPIs weekly where volume supports meaningful comparisons, and assess progress against targets monthly. Revisit external benchmarks when relevant new data becomes available. Reassess targets quarterly or after material business changes, while preserving the original baseline so progress remains visible.
5) Why do industry benchmarks sometimes fail to improve marketing performance?
Broad benchmarks aggregate data from companies with different margins, sales cycle lengths, brand equity, and budget scales. A broad average may not reflect your company’s operating conditions, and optimizing toward it can pull your team away from the targets that actually reflect your business model.
The High-Performance Trajectory
Start with the business goal and the KPI that measures it. Establish a baseline, compare relevant benchmarks, set a target, and agree on what will trigger action. The companies that turn marketing into a reliable growth driver build this deliberately. They do not simply run more campaigns and hope the results improve.
Data hygiene, system integration, and honest attribution are what make every other part of this framework trustworthy. A target built on clean data and a credible benchmark is one your team can execute against. A target built on incomplete data or inapplicable averages generates confusion instead of growth.
If your team is ready to build a performance framework that connects marketing activity to actual revenue outcomes, schedule a candid conversation with one of our experts. Bring your current metrics and your questions about what marketing is producing. We’ll help you assess the gaps and identify practical next steps.