Most marketing teams head into annual planning with the same problem: they’re making budget decisions based on assumptions they never actually tested. They allocate more to what felt like it worked, cut what didn’t seem to move the needle, and call it a strategy.
Q4 gives you time to run a focused set of marketing experiments before finalizing your 2027 plan. The goal is to answer specific questions about messaging, offers, channels, conversion, and retention, then use the results to decide what to scale, change, or test further next year.
The Q4 Prioritization Framework for Fast Marketing Experiments
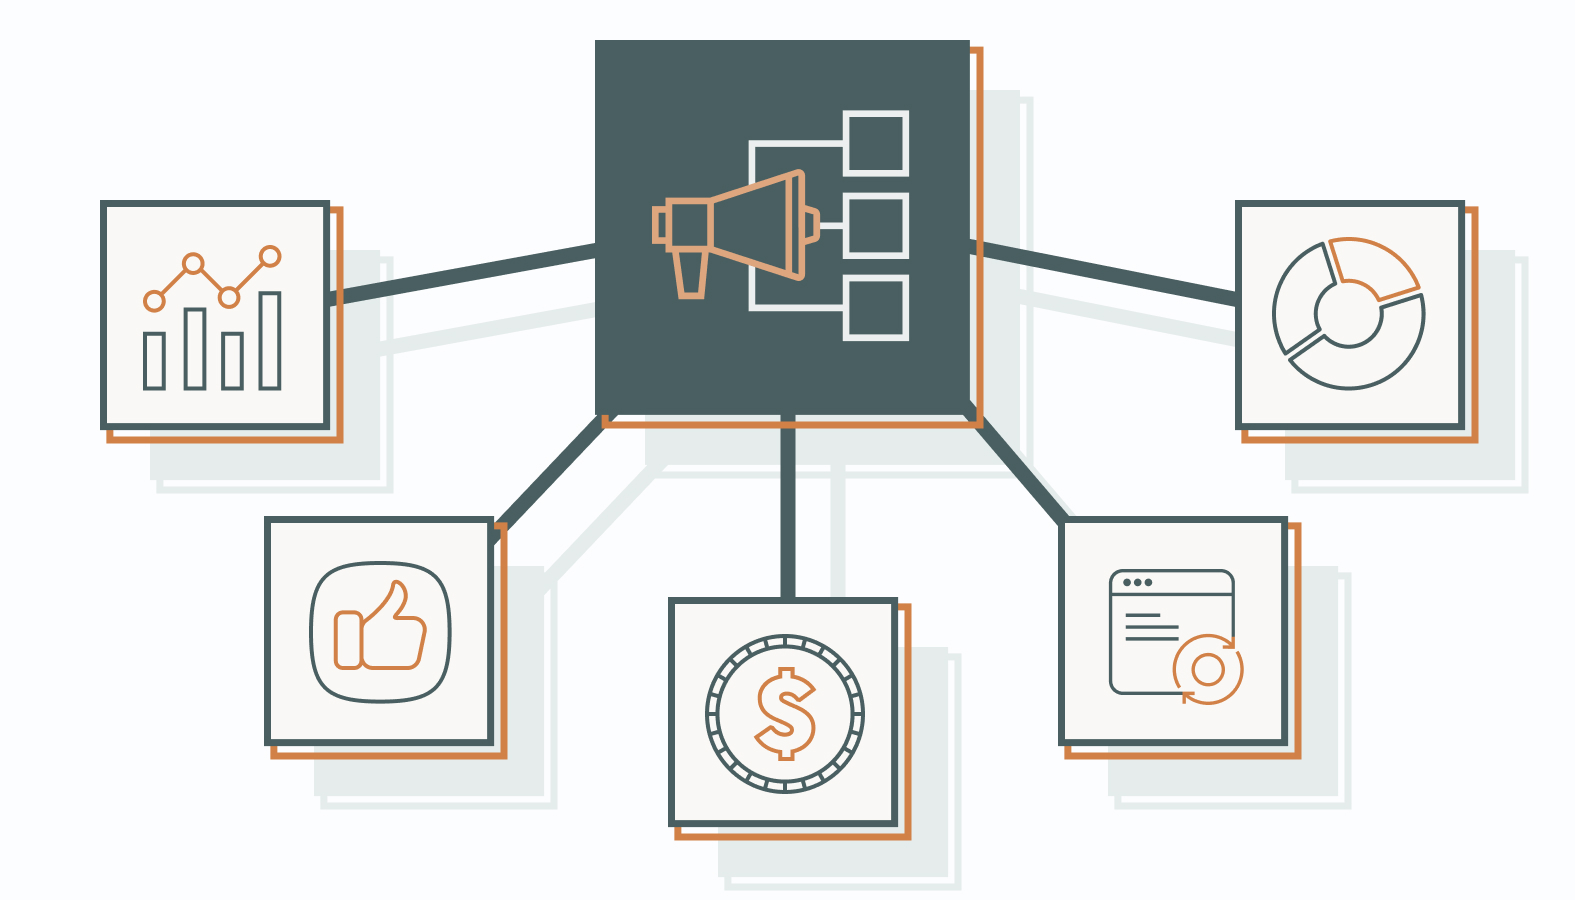
Start by choosing the questions that could change your 2027 plan. With limited time left in Q4, prioritize experiments that address a meaningful business decision and can produce useful evidence before your planning deadline.
Expected revenue impact: Will a positive result change a meaningful budget line or a core go-to-market assumption? If the answer is no, the test doesn’t belong in Q4’s limited runway.
Confidence in the hypothesis: Give higher priority to hypotheses supported by customer feedback, sales observations, or existing performance data. Lower-confidence ideas may still be worth testing when the cost is low and the potential learning is valuable.
Effort and resource cost: How much engineering, design, or copy time does this require? Q4 experiments should lean toward low-overhead setups that don’t pull resources from active revenue programs.
Reversibility: If it will affect your conversion rate or pipeline velocity within the next 24-48 hours, can you revert this decision? During Q4, it’s mandatory to have reversible decisions. Any experiment that can’t be quickly undone is a risk the business shouldn’t take in the final quarter.
Cycle Length: Can you expect the test to show significance within 4-6 weeks? If it’s going to take 90 days to get a good signal, you should be testing that in Q1, not Q4.
Score each factor from 1 to 5, with higher scores favoring greater impact, stronger evidence, lower effort, lower cost, and easier reversal. Add the scores to create a shortlist, then check whether each test can finish before your planning deadline. Use the score to guide discussion, not as a forecast of results. Choose only as many experiments as your traffic, budget, and team can support without interfering with one another.
8 Marketing Experiments to Inform Your 2027 Plan
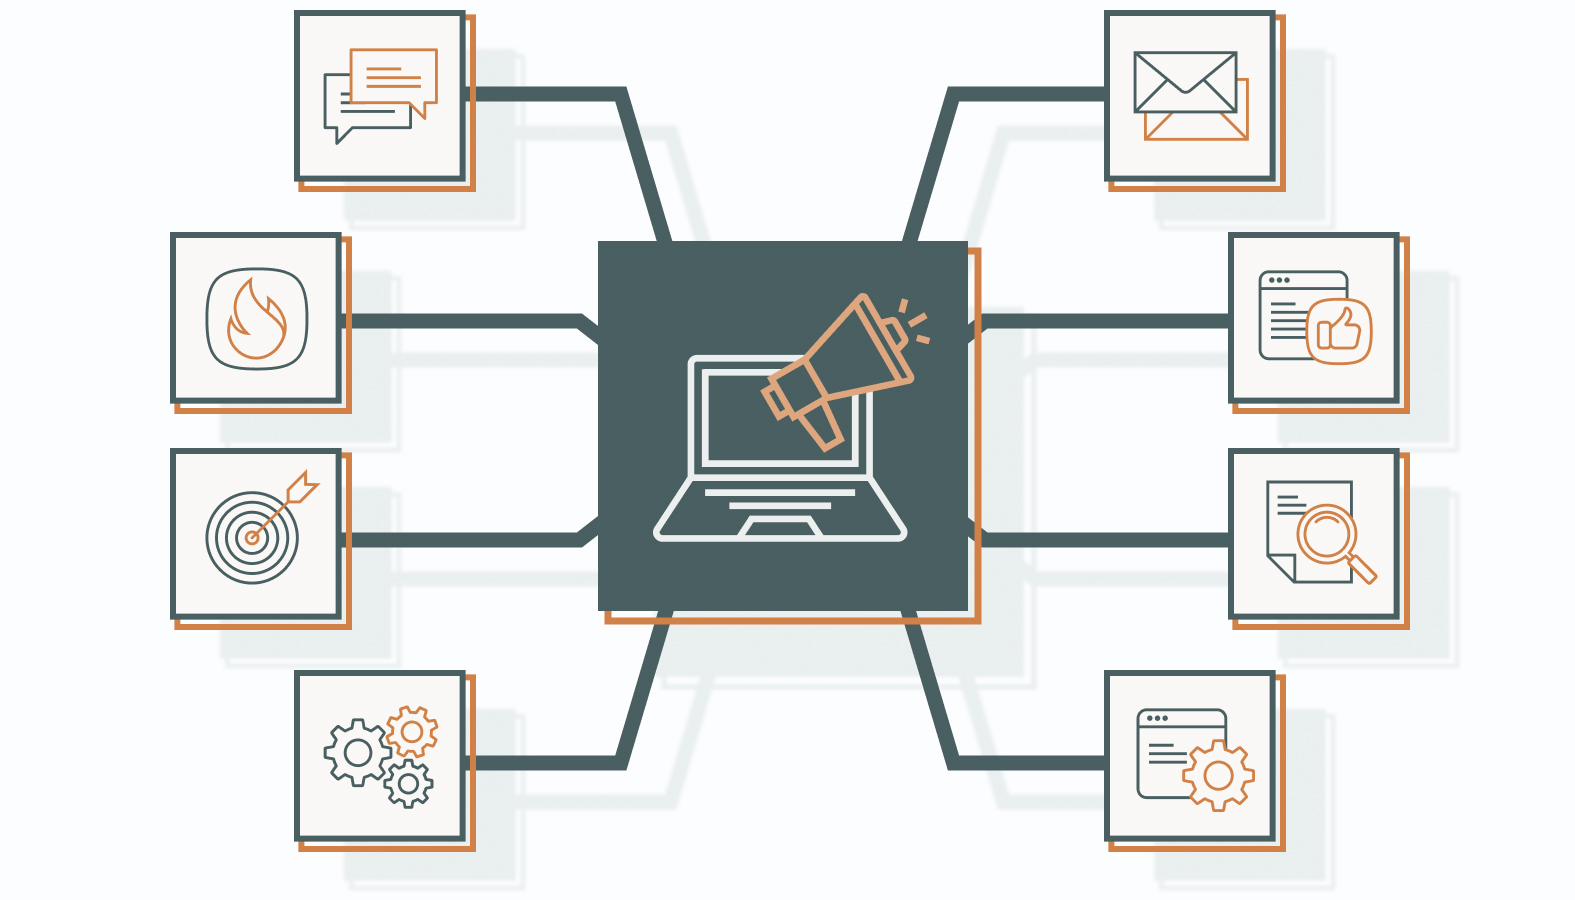
Experience marketing focuses on how people experience a brand across interactions. The experiments below include practical tests of digital touchpoints, alongside messaging, offers, acquisition, and retention. Choose the ones that answer your biggest planning questions, and define the primary KPI and decision rule before launch.
For each test, set the smallest improvement worth acting on, the required sample, the observation window, and the conditions for stopping or rolling back. For randomized A/B tests, estimate sample needs using your baseline performance and chosen statistical method. Allow time for leads or customers to reach the outcome you’re measuring. If the deadline arrives before you have enough evidence, record the result as inconclusive.
1) Messaging: Value Propositions and CTA Wording
Question: Which value proposition produces more sales-accepted leads from the same audience?
Hypothesis: A message focused on the buyer’s main business problem will increase the sales-accepted lead conversion rate compared with the current feature-led message.
Primary KPI: Sales-accepted leads divided by unique visitors assigned to each version.
Test the current message against a problem-led alternative while keeping the offer, CTA, form, and traffic source unchanged. For example, compare “Automate Your Marketing Workflows” with “Reduce Manual Follow-Up Work.” Test CTA wording separately if that is the question you need to answer.
Duration and sample: Allow at least a complete business-week cycle and enough follow-up time for sales to assess the leads. Continue to the planned sample and observation window; one week alone does not establish a winner.
Decision rule: Adopt the new message if it meets the pre-set improvement and evidence thresholds without reducing lead quality.
2027 implication: Use the supported value proposition in next year’s campaigns and sales materials, then validate it with other audiences.
2) Landing Page Performance: Above-the-Fold Pain Point Positioning
Question: Do pain-led, vertical-specific headers outperform generic feature statements in driving qualified engagement from target accounts?
Hypothesis: A headline that names a specific industry problem will increase qualified lead conversions compared with a generic feature statement.
Primary KPI: Qualified leads divided by unique visitors assigned to each page version. Track form submissions as a key event in GA4, and use CRM records to assess lead quality and company fit. GA4 does not automatically identify whether anonymous visitors belong to your target-account list.
Nielsen Norman Group’s 2018 eye-tracking research found that participants spent about 57% of their page-viewing time above the fold. That makes the first screen a useful place to test your message, although attention alone does not establish which headline will generate qualified leads.
Run both headline versions on the same landing page, keeping the offer, layout, and traffic allocation consistent.
Duration and sample: Cover complete business-week cycles, reach the planned visitor sample, and allow leads the same qualification window.
Decision rule: Choose the headline only if the qualified lead conversion rate meets the pre-set improvement and evidence thresholds. Use scroll depth as supporting context.
2027 implication: Apply the supported positioning to relevant landing pages and campaign briefs.
3) Audience Segmentation: Broad vs. Intent-Based Retargeting
Question: Are ad dollars being diluted by retargeting audiences that include low-intent visitors alongside high-intent content consumers?
Hypothesis: Separating retargeting audiences by engagement depth (visitors who read one page versus those who consumed multiple pieces of content or visited pricing) will produce a measurable difference in cost-per-qualified-lead.
Primary KPI: Cost Per Qualified Lead (CPQL)
Where your platform supports it, randomly split the eligible retargeting audience into non-overlapping test groups. Apply the current broad-retargeting approach to one group and the proposed intent-based targeting rule to the other. Keep the creative, bidding approach, timing, and budget limits comparable. If random assignment is unavailable, treat the comparison as directional rather than proof that segmentation caused the difference.
Duration and sample: Allow several delivery cycles and the usual lead-qualification lag. Estimate whether each group can generate enough qualified leads to evaluate CPQL before the deadline.
Decision rule: Expand intent-based targeting only if the CPQL improvement meets the pre-set threshold while preserving enough qualified lead volume. An inconclusive result does not prove that segmentation has no value.
2027 implication: Adjust retargeting audience rules and budget limits based on the balance between efficiency and volume.
4) Channel Mix and Content Distribution: Paid Syndication vs. LinkedIn
Question: Will syndicating your content on a paid network drive more qualified leads than promoting your content on LinkedIn?
Hypothesis: If you syndicate your content on a paid network that targets your ideal customer profile, you will see a lower cost per qualified lead.
Primary KPI: Cost Per Qualified Lead, rather than impressions, clicks, or just views.
Lead quality can vary by platform, targeting, and offer. Use your own qualification criteria to compare the channels instead of assuming one will perform better.
Promote the same content asset through a relevant syndication network and LinkedIn using comparable audience criteria, fixed budget caps, consistent tracking, and the same sales follow-up process.
Duration and sample: Use four weeks as an initial delivery window only if expected lead volume supports it, then allow the same qualification period for both channels. Treat the comparison as directional because the platforms may reach different audiences.
Decision rule: Increase allocation only when the CPQL advantage is meaningful, lead quality meets the agreed standard, and the channel can support additional volume.
2027 implication: Adjust the distribution budget and validate performance as spend increases.
5) Email Lifecycle: The “Dead Lead” Re-engagement Sequence
Question: Can you revive leads you haven’t talked to in a while?
Hypothesis: A three-email re-engagement sequence will increase the proportion of eligible dormant leads that become sales-qualified opportunities compared with the current follow-up approach.
Randomly assign eligible, contactable dormant leads to the new sequence or the current approach. Exclude unsubscribed contacts and active opportunities, and keep sales follow-up consistent.
Primary KPI: Contacts that become sales-qualified opportunities divided by all eligible contacts assigned to each group.
Duration and sample: Complete the sequence and allow the normal response and qualification window. Check that the eligible list can support the planned comparison.
Decision rule: Expand the sequence if the opportunity-rate improvement meets the agreed threshold without unacceptable increases in unsubscribes or complaints.
2027 implication: Define the audience, trigger, and timing for an ongoing re-engagement program.
6) Lead Qualification and Conversion Friction: Standard vs. Optional Qualifying Fields
Question: Will qualifying leads on your form drive more qualified leads to sales?
Hypothesis: Adding optional budget and timeline fields will improve qualification information without materially reducing the sales-accepted lead conversion rate.
Primary KPI: Sales-accepted leads divided by unique visitors assigned to each form version. Track form completion and qualification-field completion as supporting metrics.
Create two versions of your primary demo or contact form. Version A: the current form with standard fields (name, company, email, role). Version B: the same fields plus two optional qualifiers: estimated budget range and target decision timeline. Run both versions with split traffic. Coordinate with the sales team to track what happens to each lead group after handoff.
Duration and sample: Run both versions across complete business-week cycles, reach the planned visitor sample, and give sales the same time to assess each lead. Track days-to-close later if the sales cycle extends beyond Q4.
Decision rule: Keep the optional fields only if the additional information improves qualification or routing while the sales-accepted lead conversion rate stays within the pre-set acceptable range.
2027 implication: Update form requirements and lead-routing rules based on the result. Do not use a test of optional fields to justify making them mandatory.
7) Offers: Free Audit vs. Product Demo
Question: Which offer creates sales-accepted opportunities at an acceptable cost?
Hypothesis: A free audit will generate a lower cost per sales-accepted opportunity than a product demo for the selected audience.
Primary KPI: Total acquisition and offer-delivery cost per sales-accepted opportunity.
Randomly split the same eligible audience between the offers. Keep the surrounding messaging and sales follow-up consistent, and include staff time spent delivering audits in the cost comparison.
Duration and sample: Allow enough time for prospects to accept the offer and for sales to assess the resulting opportunities. Check expected opportunity volume before launch.
Decision rule: Favor the offer only if its cost advantage meets the pre-set threshold without reducing opportunity quality or exceeding delivery capacity.
2027 implication: Adjust the acquisition offer, delivery resources, and campaign budget.
8) Retention: Proactive Renewal Support
Question: Can proactive support improve renewal rates among customers approaching renewal?
Hypothesis: A targeted value-review email and support offer will increase renewals compared with the current reminder process.
Primary KPI: Renewed accounts divided by all eligible accounts assigned to each group.
Randomly split customers with comparable renewal dates between the current process and the new outreach. Keep pricing and contractual terms unchanged.
Duration and sample: Include only cohorts whose renewal decisions can be observed before the planning deadline, and give both groups the same observation window. If too few renewals are due, treat the work as a pilot and continue measurement in Q1.
Decision rule: Expand the approach if the renewal-rate improvement meets the agreed threshold and the retained value justifies the additional service cost.
2027 implication: Adjust renewal communications, customer-success capacity, and retention spending.
Turning Q4 Test Results into Your 2027 Budget
Q4 marketing experiments are most useful when their results inform your 2027 plan. Keep a shared results document that marketing, sales, and finance can access. For each test, record the question, hypothesis, findings, confidence in the result, and recommended next step.
Then complete this sentence: “Based on this result, next year we should…” If the evidence is inconclusive, gather more data or redesign the test before changing the budget.
Document negative results, too. A reliable finding that a proposed change underperformed can help prevent further spending on an ineffective approach.
When teams request more budget, ask: “What does the test data support?” Use the answer to decide what to scale, stop, or investigate further in 2027.
FAQs About B2B Marketing Experiments
1) How do we run marketing experiments if our B2B site traffic drops in late December?
If your traffic drops in late December, check whether the remaining volume can support the planned test. Email and sales outreach may provide other learning opportunities, but they can also be affected by holiday schedules and small samples. If you cannot collect enough evidence, use interviews or usability sessions to refine the hypothesis and continue testing in Q1. Do not assume that the people who respond during the holidays represent your usual buyers.
2) What is the risk of running marketing experiments without a clear prioritization matrix?
Without a prioritization matrix, teams tend to run the experiments that are easiest to set up rather than the ones that answer the most important planning questions. That produces a collection of test results that don’t connect to budget decisions. Another issue is running tests that will take longer than your planning window to produce enough reliable evidence. If you run these tests in Q4, you will not have that information when it’s time to plan for 2027. Having a test priority matrix in place will help your team figure out what they want to learn from a test before you spend the time.
3) How should we measure whether reducing conversion friction helps?
Measure both completion and downstream lead quality. An easier form may increase submissions without increasing sales-accepted leads. Track sales-accepted leads per visitor and subsequent opportunity progression to assess the business impact. Better conversion does not automatically make your pipeline forecast more accurate.
Build an Evidence-Based Growth Engine with Agency
The value of running marketing experiments before 2027 planning isn’t just what you learn. It’s what you stop doing. A reliable negative result can challenge an assumption before it shapes next year’s budget. A reliable positive result gives you a reason to consider expanding the approach, with further checks as spending or reach increases. This is what happens when you take data into account and create a growth strategy.
Companies may know what they want to test but lack a clear process for turning results into budget decisions. Agency can help connect experimentation, measurement, and growth planning so the evidence informs next year’s priorities.
Schedule a candid conversation with one of our experts. Bring your current test backlog, your Q4 budget constraints, and your biggest unanswered planning questions, and we’ll help you build a short-cycle experiment portfolio that puts real evidence behind your 2027 decisions.