
Marketers love data, until they’re drowning in it. Reports pile up, dashboards get messy, and before long, teams are reacting instead of planning. The good news is, marketing analytics tools are designed to flip that chaos into clarity. They help turn raw clicks, conversions, and customer behavior into insights that tell you not just what happened, but why.
Still, the sheer number of tools available today makes choosing the right one harder than ever. Pick the wrong one, and you’re stuck with a system that complicates more than it solves.
In this guide, we’ll break down the top platforms, their standout features, and how they integrate into real-world marketing workflows. By the end, you’ll know which tools can simplify your data and sharpen your strategy.
The Real Value of Marketing Analytics Tools
In marketing, data is the currency of smart decisions. But raw data by itself? Useless.
The right analytics tools convert overwhelming spreadsheets and dashboards into focused insights. That shift, from noise to clarity, is what keeps businesses competitive, campaigns agile, and strategies profitable.
These platforms move you past raw spreadsheets and surface-level metrics. They reveal patterns in behavior, performance, and revenue, then turn them into clear actions that fuel growth. Analytics tools are now business-critical; the engine behind smarter, faster decisions.
What Are Marketing Analytics Tools?
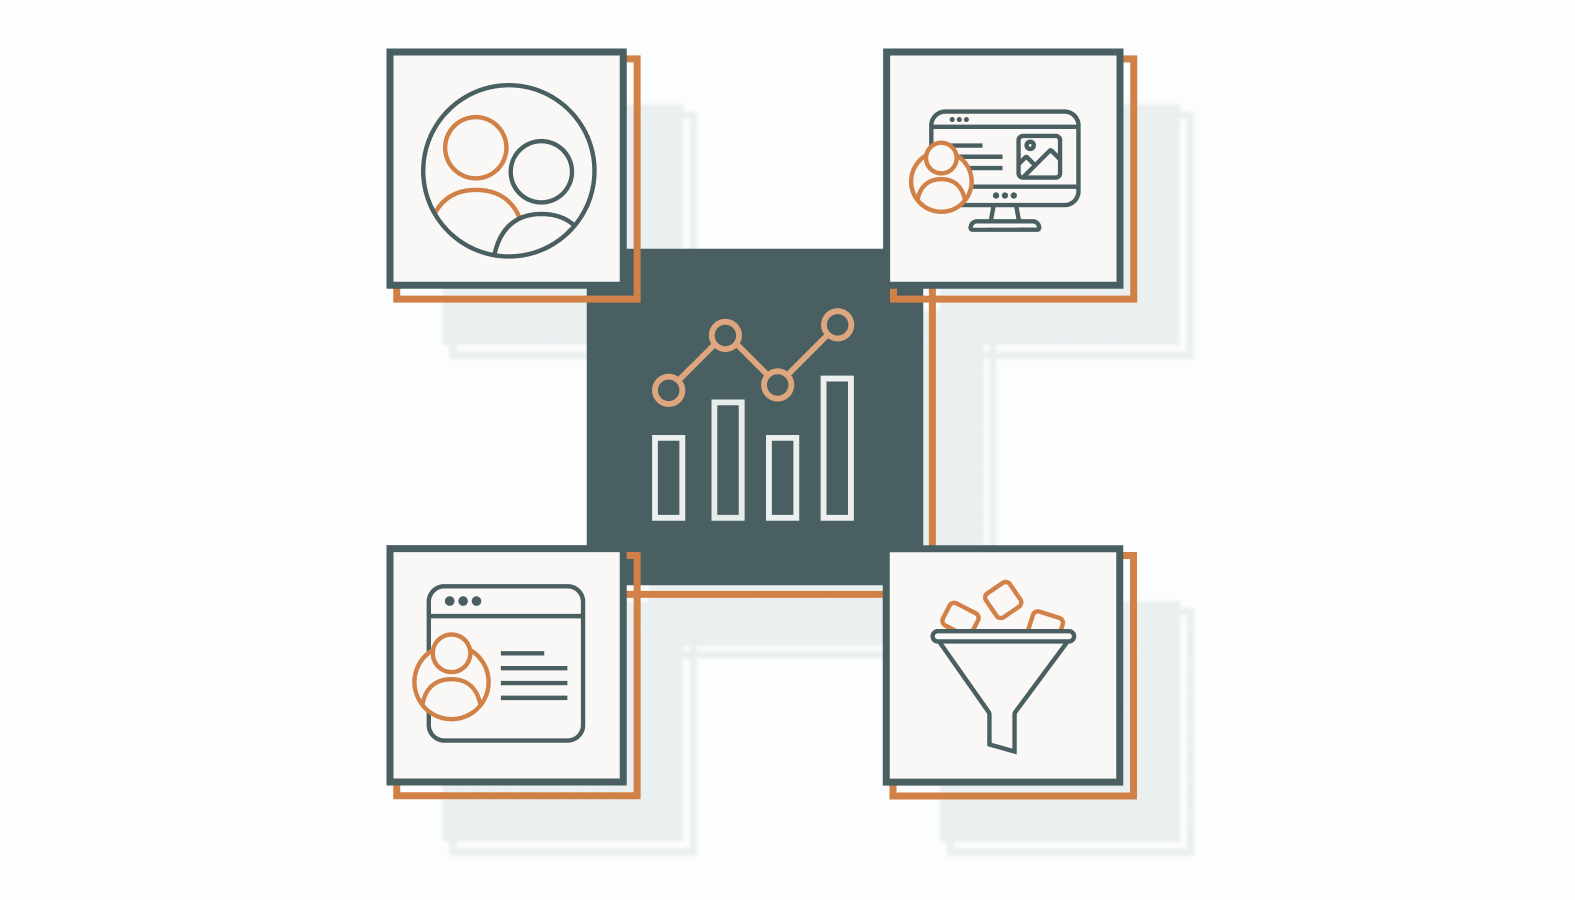
At their core, these are software systems built to capture, analyze, and report on marketing activity. Their value lies in taking fragmented data streams and presenting them as a coherent picture you can act on.
Here’s what they typically handle:
- Audience insights: demographics, interests, and engagement patterns.
- Digital traffic: website visits, clicks, and navigation flow.
- Social activity: posts, shares, and sentiment.
- Sales performance: conversions, revenue contribution, and ROI.
The benefit? A unified view of the customer journey. Instead of guessing which campaign worked or why engagement dropped, marketers gain visibility across every channel. That alignment is what sharpens strategy and maximizes ROI.
Key Features to Look For
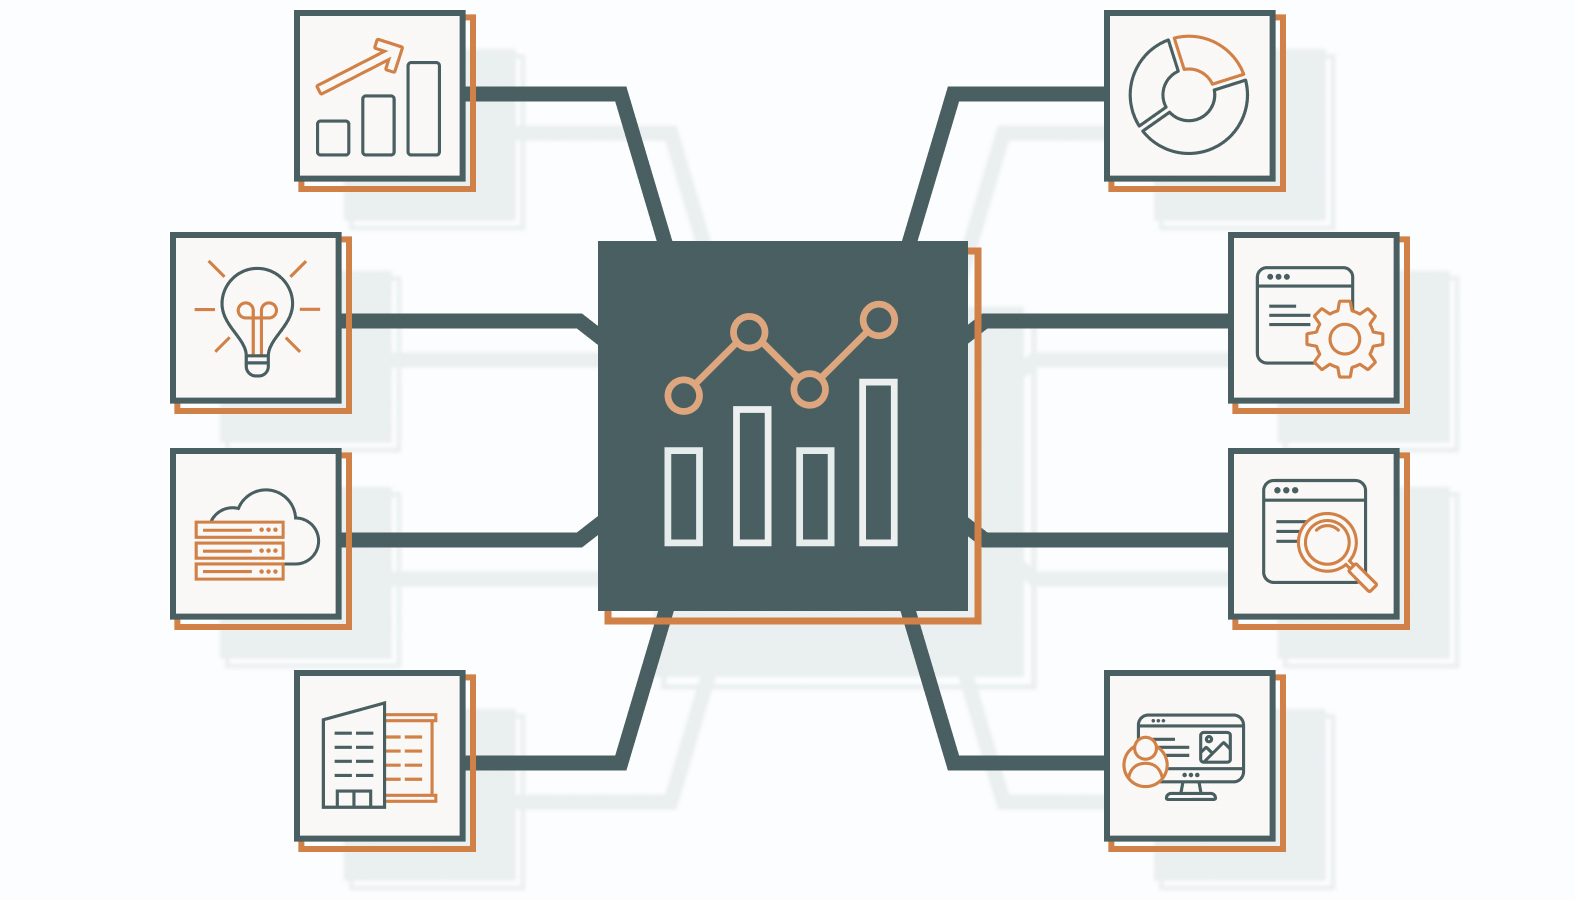
Plenty of tools promise “analytics.” The difference lies in the execution. Look for features that not only present data but make it actionable:
- User-Friendly Interface. Complex platforms end up gathering dust. An intuitive design enables new team members to get up to speed quickly, while senior leadership can generate their own reports without needing a crash course. Adoption accelerates when the tool works for everyone, not just the data team.
- Real-Time Data Processing. Timing is everything. Live insights let marketers pivot mid-campaign, whether that’s shifting spend to a high-performing channel or adjusting messaging in response to customer feedback.
During moments like a product launch, real-time dashboards can surface a trending hashtag to amplify (or a negative comment to defuse) before momentum swings.
- Customizable Reporting and Dashboards. Every stakeholder has unique needs. Executives want high-level KPIs, while campaign managers need granular views. Customizable dashboards keep every stakeholder aligned without drowning anyone in irrelevant detail.
- Integration Capabilities. The most valuable tools don’t live in isolation. The real value comes from tying data across CRM, email, and ad platforms into a single narrative.
This integration enables you to see exactly how an email campaign drove a site visit, or calculate the precise ROI of a paid search ad, all in one place.
- Advanced Analytics and Predictive Modeling. Reporting on the past is helpful. Predicting the future is a competitive edge.
Predictive modeling can surface emerging trends, highlight customers at risk of churn, and identify which audiences are most likely to convert. These insights give marketers the foresight to act before competitors even spot the opportunity.
Don’t stop at features alone. Picking a tool that works today is only half the game. The real advantage comes from choosing solutions built to adapt — platforms that won’t just meet current needs but will keep pace as marketing evolves.
In other words, future-proof your strategy by looking at the trends shaping analytics now and into the years ahead.
Trends in Marketing Analytics
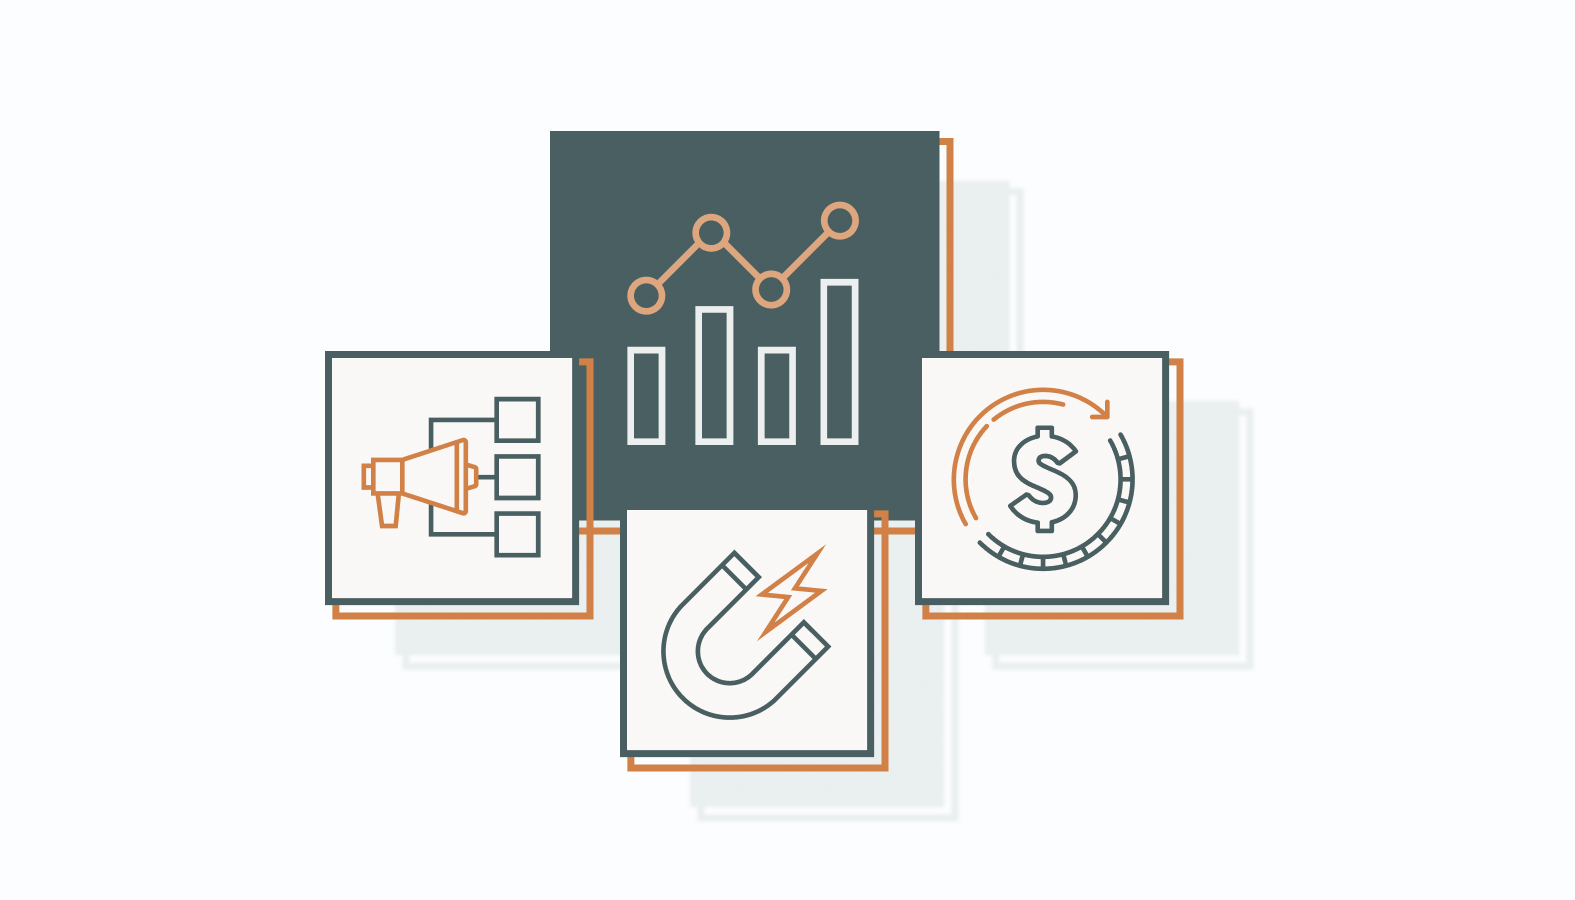
The future of marketing analytics is about anticipating, prescribing, and automating the next move. Three shifts define the road ahead:
1) From Descriptive to Prescriptive
AI (artificial intelligence) and ML (machine learning now push tools beyond reporting. They can forecast demand, predict conversions, and recommend actions to optimize spend. Think less “what happened” and more “what to do next.”
With third-party cookies disappearing, the spotlight is on first-party data. Tools that integrate with CRMs, loyalty programs, and subscriptions offer rich insights without compromising compliance. Systems that anonymize or aggregate user data while preserving accuracy will dominate.
3) Unified Marketing Platforms
Marketers are tired of juggling a dozen disconnected tools. The future belongs to platforms that centralize all performance metrics into one system of record. This shift reduces complexity, eliminates silos, and delivers a single version of truth.
Marketing analytics tools have shifted from optional add-ons to core infrastructure. The real winners aren’t the ones that just report numbers. They’re the platforms that uncover insights, predict outcomes, and plug seamlessly into your entire marketing ecosystem.
Top Marketing Analytics Tools of 2025
Data is everywhere, but clarity is rare. The right analytics platform turns overwhelming numbers into a competitive advantage. Let’s break down the standout tools shaping marketing this year.
Whatagraph: Reporting Without the Headache
Who It’s For: Agencies and in-house teams that need fast, client-ready reporting without drowning in complexity.
Whatagraph takes messy, complex data and turns it into reports clients actually want to read. Its drag-and-drop interface makes building custom dashboards effortless; no technical skills required.
Pull in data from multiple platforms, see real-time updates, and deliver reports that are both visually sharp and strategically useful.
Why it matters: It eliminates reporting bottlenecks so teams spend less time wrangling data and more time acting on it.
- Pros: Sleek, professional reports; seamless multi-source integrations; real-time syncing.
- Cons: Limited depth for advanced analysis; customization options can feel restrictive.
- Cost: Plans start around $200/month, with pricing that scales by users and data volume.
Google Analytics 4: Smarter Tracking, Smarter Forecasts
Who It’s For: Marketers and teams who need a future-proof analytics platform that tracks across web and app while offering predictive insights.
GA4 is Google’s upgrade built for today’s cross-platform world. It doesn’t just log visits; it uses machine learning to forecast customer behavior and surface actionable predictions.
By unifying data from websites and mobile apps, GA4 provides a full picture of the user journey, helping marketers anticipate actions and optimize strategies with confidence.
Why it matters: This unified view helps marketers understand the full customer journey, not just isolated web sessions.
- Pros: Free entry point; AI-driven predictions; cross-device and cross-platform tracking.
- Cons: Steeper learning curve than Universal Analytics; setup and migration require planning.
- Cost: Free, with enterprise features available through Google Analytics 360 (custom pricing).
Microsoft Power BI: Enterprise Muscle with Flexibility
Who It’s For: Enterprises and data-driven teams already operating within Microsoft’s ecosystem who need scalable, customizable analytics.
Power BI transforms raw data into insights executives can act on. Its strength lies in powerful visualizations, seamless integration with Microsoft 365 and external data sources, and dashboards that can be tailored to precise business needs.
Whether you’re analyzing performance across departments or drilling down into campaign specifics, Power BI delivers clarity at scale.
Why it matters: It bridges massive datasets and strategic decisions, making complex organizations more agile.
- Pros: Deep Microsoft integrations; highly customizable dashboards; strong visual storytelling; cost-effective entry point.
- Cons: Overkill for smaller teams; best suited for advanced users comfortable with complex datasets.
- Cost: The Pro version is $10/user/month, with Premium and Enterprise tiers priced higher based on scale.
Adobe Analytics: Precision for Power Users
Who It’s For: Large enterprises that demand deep, customizable analysis and have the resources to manage complexity.
Adobe Analytics is built for marketers who want surgical precision. Its real-time data processing and advanced segmentation give teams the ability to dissect customer journeys with unmatched detail.
This is the tool you use when surface-level metrics won’t cut it, and you need to understand exactly what drives outcomes across every channel.
Why it matters: It gives enterprise teams the ability to fine-tune campaigns with a level of detail competitors can’t match.
- Pros: Industry-leading depth; robust segmentation; enterprise-level integrations.
- Cons: Expensive and complex, with a steep learning curve for new users.
- Cost: Enterprise pricing, often starting in the thousands per month.
Google Analytics (Standard): The Workhorse
Who It’s For: Small to mid-sized businesses that need reliable, straightforward tracking without the complexity of advanced tools.
Google Analytics remains a cornerstone in digital marketing. It tracks traffic, conversions, and goals with ease, providing a solid foundation for anyone getting started. While GA4 is the future, the standard version is still the go-to entry point for clear, actionable insights.
Why it matters: It lowers the barrier to entry for data-driven marketing by giving SMBs a powerful tool at zero cost.
- Pros: Free; user-friendly; strong for foundational tracking.
- Cons: Less advanced than GA4; limited predictive capabilities.
- Cost: Free.
HubSpot: Analytics Meets Automation
Who It’s For: Growth-focused teams seeking a single platform for analytics, automation, and CRM.
HubSpot goes beyond tracking. It merges analytics with marketing automation, giving marketers a single hub to run campaigns, nurture leads, and monitor the customer journey. The clean interface and unified view make it especially powerful for teams scaling their inbound strategies.
Why it matters: It closes the gap between insights and action by uniting analytics with campaign execution.
- Pros: All-in-one platform; excellent for lead nurturing; intuitive interface.
- Cons: Expensive as you scale; reporting depth lags behind dedicated analytics tools.
- Cost: Free entry-level plan; advanced plans start at $45/month and scale to enterprise pricing.
SEMrush: Competitor Intel at Your Fingertips
Who It’s For: SEO pros, content teams, and marketers focused on gaining an edge in search visibility.
SEMrush is the go-to suite for dominating SEO. It does far more than keyword tracking, offering deep insights into competitor strategies, backlink profiles, and search performance. For teams serious about organic growth, SEMrush provides the competitive intel needed to win.
Why it matters: By surfacing competitor tactics and market trends, SEMrush helps teams ensure their content is discoverable.
- Pros: Best-in-class SEO toolkit; robust competitor analysis; constantly updated features.
- Cons: Steep interface for new users; limited value outside SEO metrics.
- Cost: Starts at $129.95/month.
Tableau: Data That Speaks Visually
Who It’s For: Analysts and marketing teams that need to present data in a clear, compelling way to decision-makers.
Tableau turns complex data into visual stories executives actually want to look at. With highly customizable, interactive dashboards and connections to multiple data sources, Tableau helps teams uncover insights and communicate them effectively. The result isn’t more analytics, but the ability to shape decisions and drive action.
Why it matters: It transforms raw numbers into stories that drive executive buy-in and strategic action.
- Pros: Best-in-class visualizations, highly customizable, and interactive dashboards.
- Cons: Pricey at scale; requires training to unlock full potential.
- Cost: Starts at $70/user/month.
Analytics tools in 2025 (and beyond) are less about collecting data and more about translating it into action. Whether you need polished reports for clients, predictive insights for planning, or a full-stack platform for automation, there’s a tool built for your reality.
The trick isn’t finding “the best,” but finding the one that matches your team’s needs, budget, and growth strategy.
How to Use Analytics Tools for Every Stage of the Customer Journey
The customer journey isn’t a straight line — it’s a maze. Analytics tools give you the map. A strong strategy connects every stage, from the first touch to long-term loyalty.
The right tools reveal how people discover you, what keeps them interested, and what finally gets them to commit.
Awareness Stage: Spot What Brings People In
At the top of the funnel, analytics reveal where new audiences are finding you. By breaking down traffic sources (from search, ads, social, or referrals), you see which channels actually bring in value, not just vanity clicks.
This is where tools like Google Analytics 4 (GA4) and SEMrush earn their keep. They surface top-performing keywords, high-traction campaigns, and the content that resonates most with new visitors. Armed with this intel, you can double down on proven winners and refine outreach where it matters most.
The payoff: Instead of burning budget on busy channels that look good in a dashboard but don’t convert, you focus your spend where it actually drives growth.
Consideration Stage: Decode Buying Signals
Once prospects shift into evaluation mode, analytics expose intent. You’re not just tracking clicks. You’re learning which pages hold attention, which videos get watched, and what actions suggest a buyer is leaning in.
This is where event tracking takes center stage. By tagging actions like “view product,” “add to cart,” or “watch demo,” you can build a detailed profile of customer intent.
These insights fuel your content strategy. Case studies, comparison guides, and whitepapers suddenly have direction because you know exactly what questions buyers are asking and what proof they need before saying yes.
The payoff: You stop guessing and start aligning messaging with evidence of intent, guiding prospects naturally toward purchase.
Conversion and Loyalty: Tie Actions to Outcomes
At this stage, analytics stop being “nice to have” and become mission-critical. It’s where you measure what actually worked and link outcomes to revenue.
Tools like HubSpot and Adobe Analytics do more than count conversions. They connect each sale back to the specific touchpoints that drove it. That means ROI is no longer a guess, but a precise calculation.
And the value doesn’t end at the first purchase. Tracking repeat orders, lifetime value (LTV), and referrals helps you spot your most profitable customers and build retention campaigns that keep them coming back.
The payoff: Instead of chasing one-off wins, you engineer long-term growth by knowing exactly which customers drive the most impact and how to keep them loyal.
Building a Marketing Analytics Stack: A Practical Guide
Building an analytics stack is the difference between noisy data and clear decisions. Pick tools that work together and scale with you.
Follow these steps to assemble a practical, scalable stack.
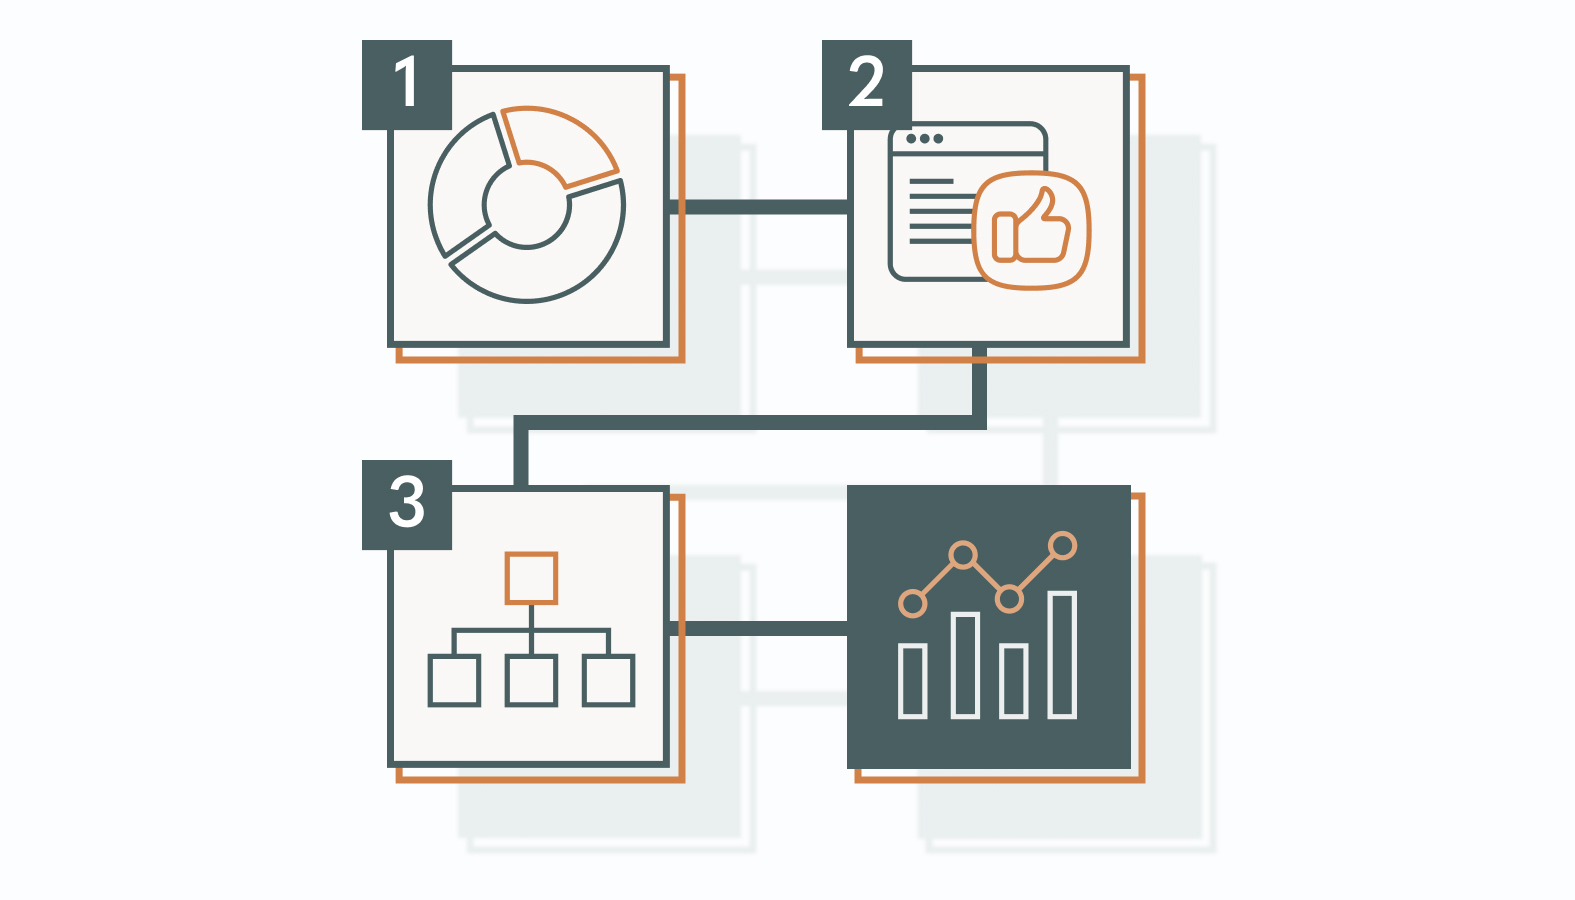
1) Start with a foundational analytics platform. For most businesses, this will be a robust web analytics tool like Google Analytics 4 (GA4) or a comprehensive platform like Adobe Analytics. This is your “source of truth” for website and app behavior, providing the core data you’ll build on.
2) Integrate tools for specific channel analytics.
If social media is a key part of your strategy, a tool like Whatagraph can pull data from various social platforms into one dashboard.
If SEO is your priority, a tool like SEMRush is a must-have for competitive analysis and keyword tracking. The goal is to utilize specialized tools that offer deeper insights than your foundational platform.
3) Connect your analytics with your business operations.
This is where integrations with CRM systems (like HubSpot or Salesforce) and data visualization tools (like Tableau or Microsoft Power BI) become critical.
By linking marketing data with sales data, you can move beyond just tracking clicks and conversions to measuring actual revenue generated by your campaigns.
Visualizing this combined data in a custom dashboard allows you to present a clear, compelling story about marketing’s contribution to the bottom line.
A strong analytics stack compounds over time. Data leads to insights, which fuel better campaigns, and these in turn generate stronger data. That loop is the engine of data-driven growth and the reason your stack should be designed for scale, not clutter.
The Case for Centralizing Marketing Data
Scattered data slows teams down. Centralized data speeds them up. When every channel feeds into a single system of record, decisions get sharper, teams move faster, and budgets work harder.
Here’s what centralization unlocks.
Simplify Data Management Processes
Managing ten different data sources is like herding cats. A centralized system cuts duplication, reduces errors, and gives every team the same playbook.
The result: marketing runs smoother, and leadership finally trusts the numbers.
Gain Deeper Insights Through Comprehensive Analysis
When search, social, email, and sales data live in the same ecosystem, patterns surface that would otherwise stay hidden.
Suddenly, you can see which campaigns actually move revenue and which channels only make noise.
Enhance Data Accessibility and Uniformity
Data locked in silos is useless to the people who need it most. Centralization makes insights accessible across teams, so marketing, sales, and leadership all make decisions from the same set of facts.
Alignment stops being a buzzword and starts being a habit.
Improved Strategic Decision-Making
With the full picture in one place, planning stops being guesswork. You can allocate resources with precision, target the right audiences, and back every move with evidence.
Strategy gets sharper because it’s anchored in reality, not hunches.
Boost Efficiency and Reduce Costs
Centralizing isn’t just about better data. It’s about doing more with less.
By eliminating redundant tools and manual reporting, you cut costs and free up talent to focus on growth instead of spreadsheet wrangling.
Effective Strategies for Implementing Marketing Analytics Tools
Buying the right tools is only half the game. How you roll them out determines whether analytics become a growth engine or just another underused subscription. A disciplined implementation process ensures your team gets insights they can act on, not just more reports to ignore.
Here’s how to set it up for success.
Set Up Your Dashboard to Answer Real Questions
A dashboard is useless if it’s just a data graveyard. Build them around the questions decision-makers ask most often: What’s working? What’s wasting budget? Where are we gaining ground?
Keep them visual, navigable, and clutter-free so insights are immediate, not buried.
Begin by identifying the metrics that directly tie to business objectives and make them the centerpiece. Keep layouts visual, intuitive, and clutter-free, so insights are obvious at a glance. The goal is speed: decision-makers shouldn’t dig for answers; they should see them instantly.
Establish Data Governance and Security
Bad data is worse than no data. Establish clear rules for ownership, access, and quality maintenance. Protect it like an asset with encryption, audits, and compliance guardrails.
Strong governance keeps your analytics clean, reliable, and trusted across the org.
Align Analytics Tools with Marketing Goals
Tools are only as good as the targets they serve. Define measurable goals and key performance indicators (KPIs) up front, then configure analytics to track against them.
Review regularly. Metrics that mattered last year may not move the needle today. Alignment ensures every dashboard and report points toward growth, not vanity.
Ensure Cross-Departmental Collaboration
Analytics lose power when they stay siloed. Make data accessible across marketing, sales, product, and finance so everyone’s solving the same puzzle.
Regular cross-functional syncs and shared dashboards keep teams aligned and insights actionable. Collaboration turns isolated numbers into company-wide impact.
Automate Data Collection and Reporting
Manual reporting is where accuracy goes to die. Automate workflows to pull, clean, and distribute data without human bottlenecks. This frees teams to analyze, strategize, and act while minimizing errors.
Automation keeps your analytics fast, consistent, and scalable.
Troubleshoot Common Implementation Challenges
Rolling out new tools always hits friction: resistant teams, technical hiccups, messy migrations.
Solve it with training, tight IT collaboration, and a feedback loop that catches problems early. Stay flexible, adjust fast, and keep users confident.
Smooth adoption is the difference between a tool that’s used and one that collects dust.
Turning Data Into a Growth Engine
The right marketing analytics tools shape strategy. They take scattered data, translate it into clear insights, and point teams toward smarter moves. That’s how businesses cut wasted spend, engage customers better, and stay a step ahead of competitors.
The key is fit. Choose tools that match your team’s goals, scale, and workflows. Ensure they integrate smoothly, surface the key metrics, and are simple enough to be used. When the right platform meets the right strategy, analytics stop being a reporting exercise and start being a competitive edge.
Ready to cut through the noise and put your data to work? Schedule a candid conversation with one of our experts; we’ll help you build the right analytics stack and seamlessly integrate it into your workflows.